
If you're running social media for a brand and still guessing what's working, Hootsuite Analytics is likely already on your radar. It's one of the most widely used reporting tools in the social media management space, and for good reason, it consolidates metrics from multiple platforms into a single dashboard so you're not tab-hopping between Instagram Insights, TikTok Analytics, and LinkedIn stats all day.
But here's where things get interesting. Knowing your numbers is step one. Turning those numbers into a system that actually drives revenue is a different challenge entirely. That's exactly what we do at SocialRevver, we build data-driven content engines that use performance analytics (from tools like Hootsuite and beyond) to create predictable growth loops for founders, creators, and business owners.
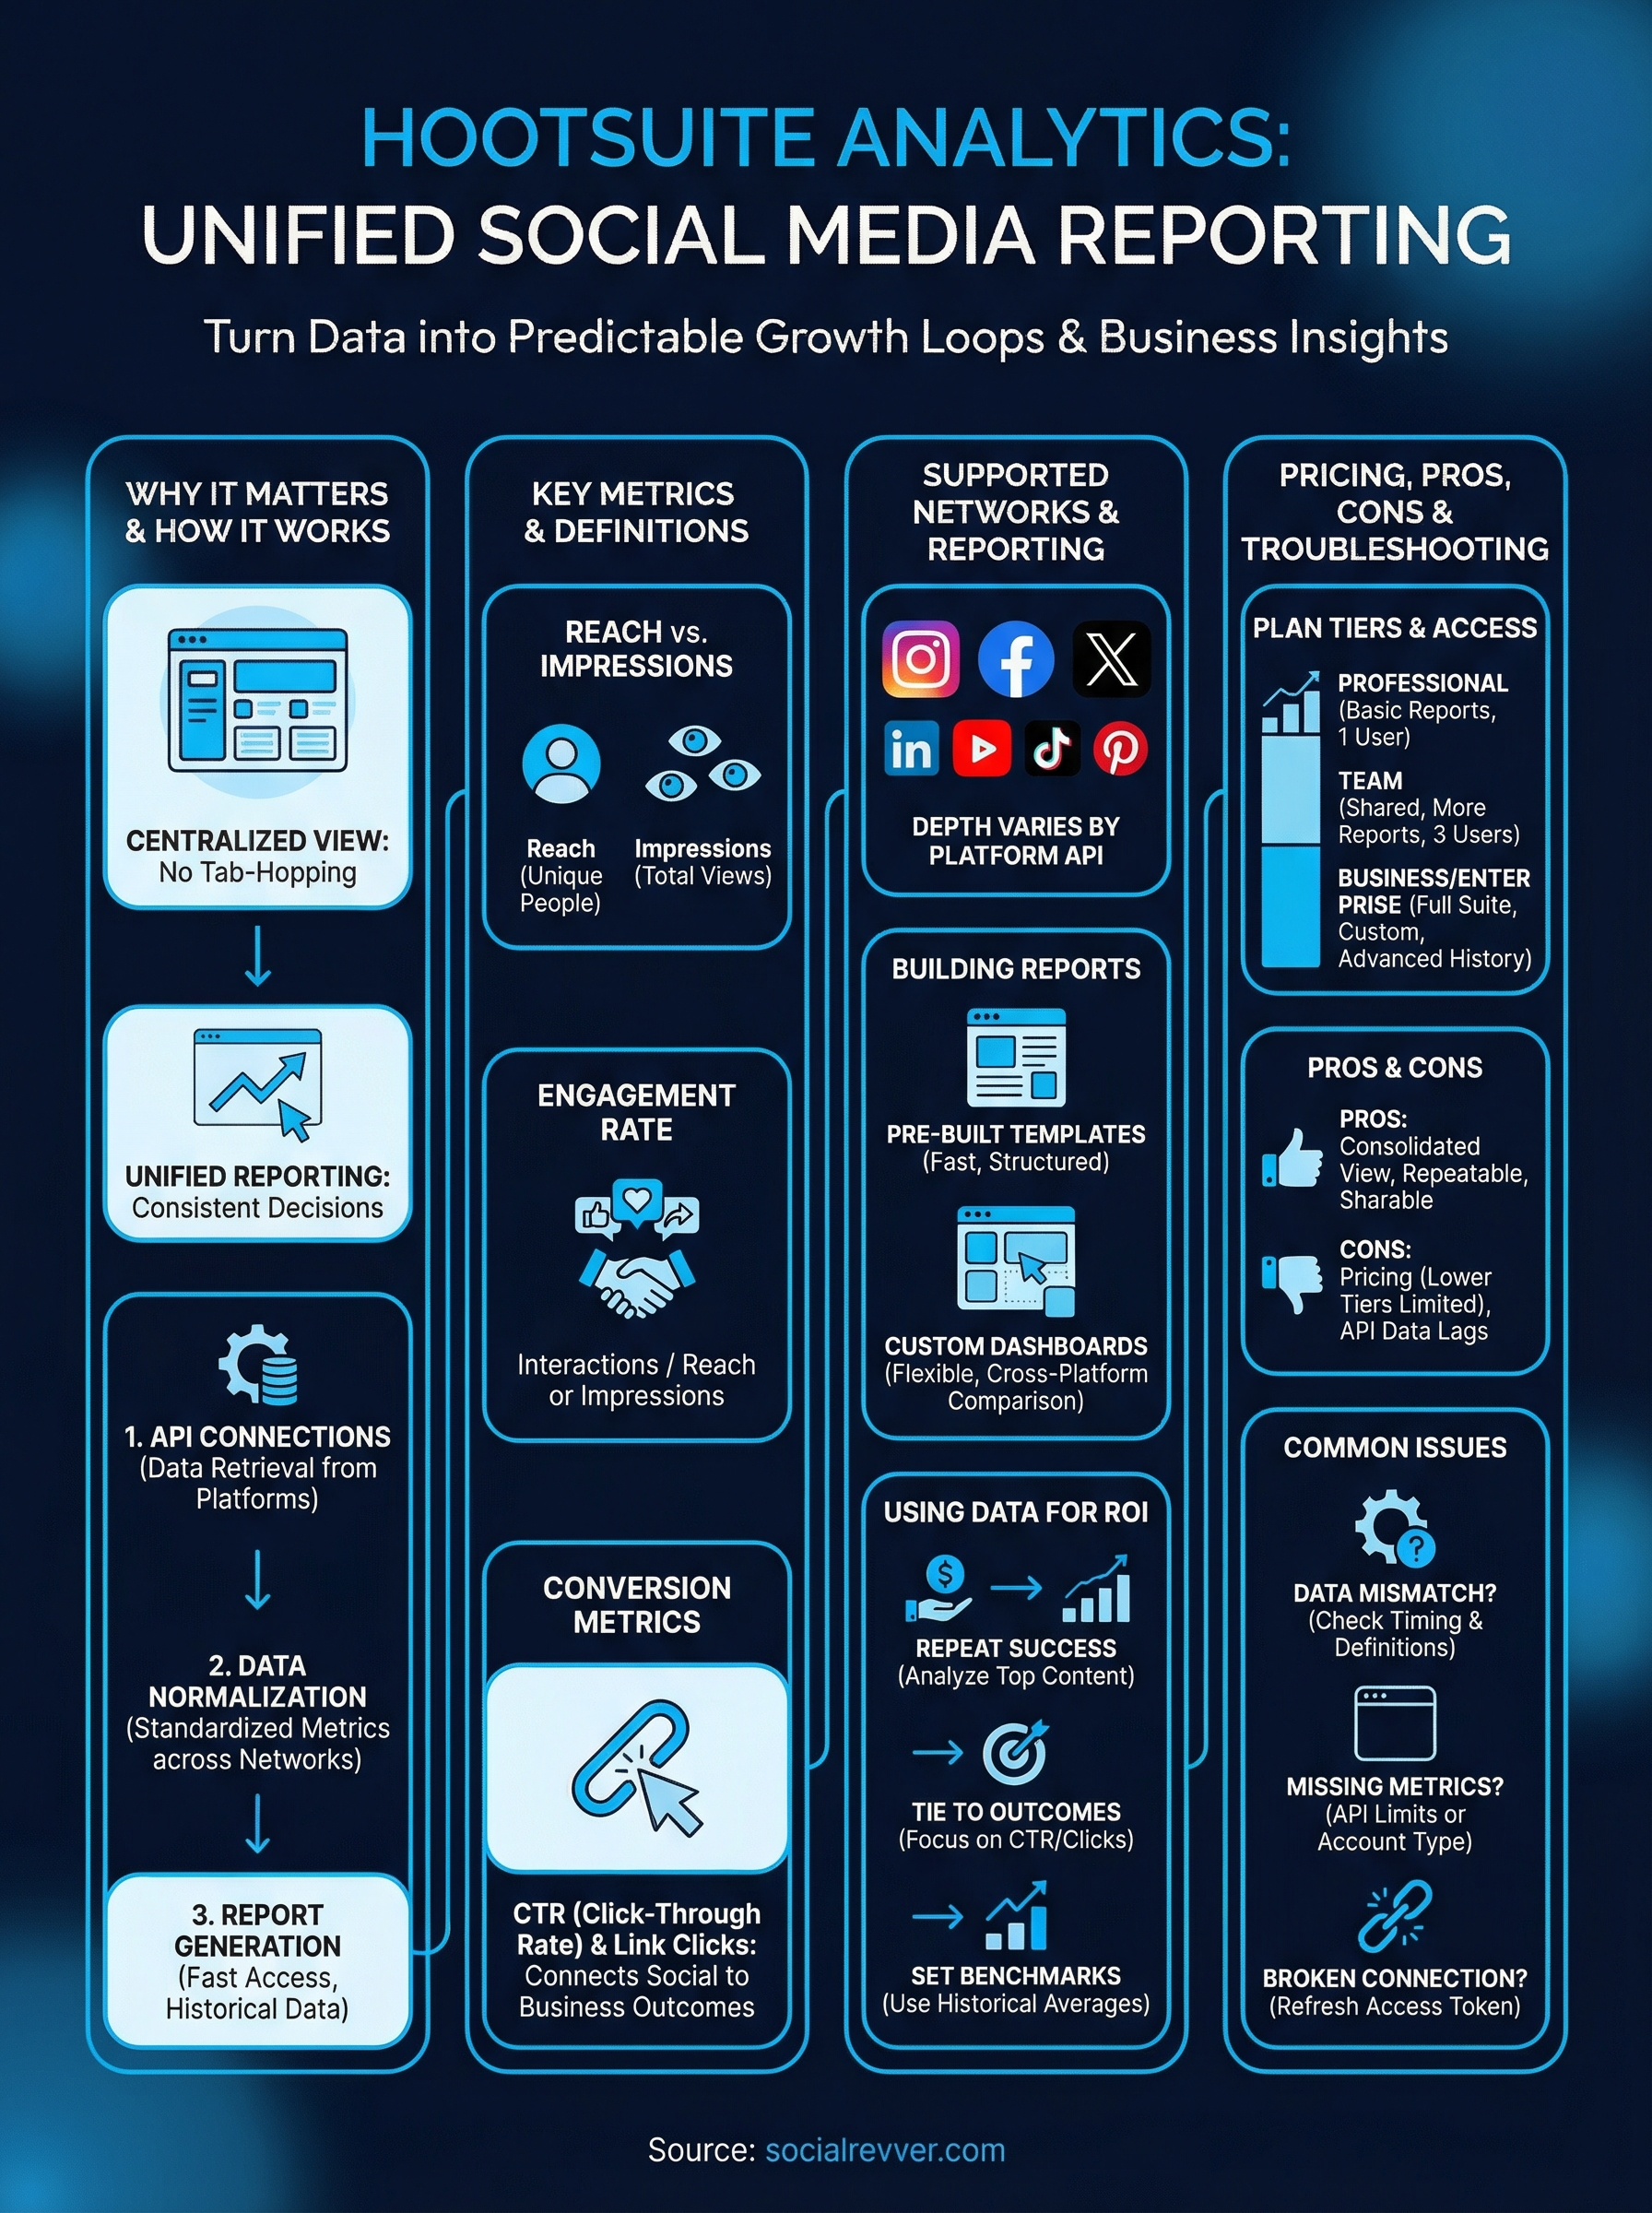
This guide breaks down everything you need to know about Hootsuite Analytics: what metrics it tracks, how to pull and customize reports, what it costs across different plan tiers, and whether it's actually worth the investment. We'll also cover practical walkthroughs so you can start using the platform with confidence, or decide if a different approach fits your goals better.
Why Hootsuite Analytics matters for social teams
Social media without data is just guesswork at scale. Most social teams are managing multiple platforms simultaneously, and without a unified reporting layer, they're making decisions based on incomplete pictures. Hootsuite Analytics addresses this directly by giving teams a centralized view of performance across every active channel, which means less time chasing numbers and more time acting on what those numbers reveal.
The cost of flying blind on social media
When your team doesn't have reliable data, the default strategy becomes posting more and hoping something lands. This approach wastes budget, team hours, and creative energy on content that may never connect with your actual audience. Platforms like Instagram, LinkedIn, and TikTok each have native analytics, but those tools only show you what's happening on that one platform. Comparing performance across networks without a consolidated tool means manually exporting spreadsheets, aligning date ranges, and reconciling different metric definitions, a process that costs hours every reporting cycle.
The time your team spends stitching together data from five separate dashboards is time it isn't spending on strategy, creative decisions, or audience research.
Compounding this problem is the reality that leadership rarely wants platform-specific data. Executives want to know what social is doing for the business, not how one Instagram Reel performed against another. Without a single reporting layer, translating raw platform metrics into business-level insights becomes a manual, error-prone exercise that slows down every decision-making conversation.
From scattered data to one source of truth
Unified analytics change how your team operates at a structural level. Instead of asking "what happened on Instagram this week," you start asking "what content format performed best across all channels this month." That shift in framing leads to better decisions. Cross-platform visibility lets you identify which networks are actually moving the needle for your specific audience, so you can allocate resources based on evidence rather than habit.
Your reporting cadence also becomes faster and more reliable. When all your performance data lives in one place, you can generate weekly reports, pull custom date ranges, and share results with stakeholders without rebuilding the same charts from scratch every time. Consistent, repeatable reporting is what separates teams that operate reactively from teams that operate strategically.
Why the data layer is the foundation of growth
Content decisions and analytics are not separate workstreams. Every creative choice you make, from hook structure to posting time, should be grounded in what the data tells you about your audience's behavior. Without that feedback loop, you're effectively resetting your strategy from zero with every new campaign. Analytics give you the institutional memory that makes each content cycle smarter than the last.
For social teams operating at scale, the data layer is also where accountability lives. When leadership asks why engagement dropped last quarter or how a campaign influenced pipeline, you need precise, defensible numbers. Hootsuite Analytics gives your team the infrastructure to answer those questions clearly, without scrambling through exported files or conflicting platform reports.
Building that infrastructure also sets the foundation for testing. Structured A/B comparisons between content formats, captions, and posting schedules become possible when you have consistent data collection across all channels. Without that consistency, you're drawing conclusions from samples that aren't comparable. With it, you start building a compounding knowledge base that makes every future content decision more precise and more confident.
What Hootsuite Analytics includes and supports
Hootsuite Analytics is not a single report button. It's a full reporting environment built into the Hootsuite platform that collects, organizes, and visualizes performance data from your connected social media accounts. The scope of what it covers depends on your plan tier, but even at the entry level, you get access to core metrics across multiple channels without switching between native platform dashboards.
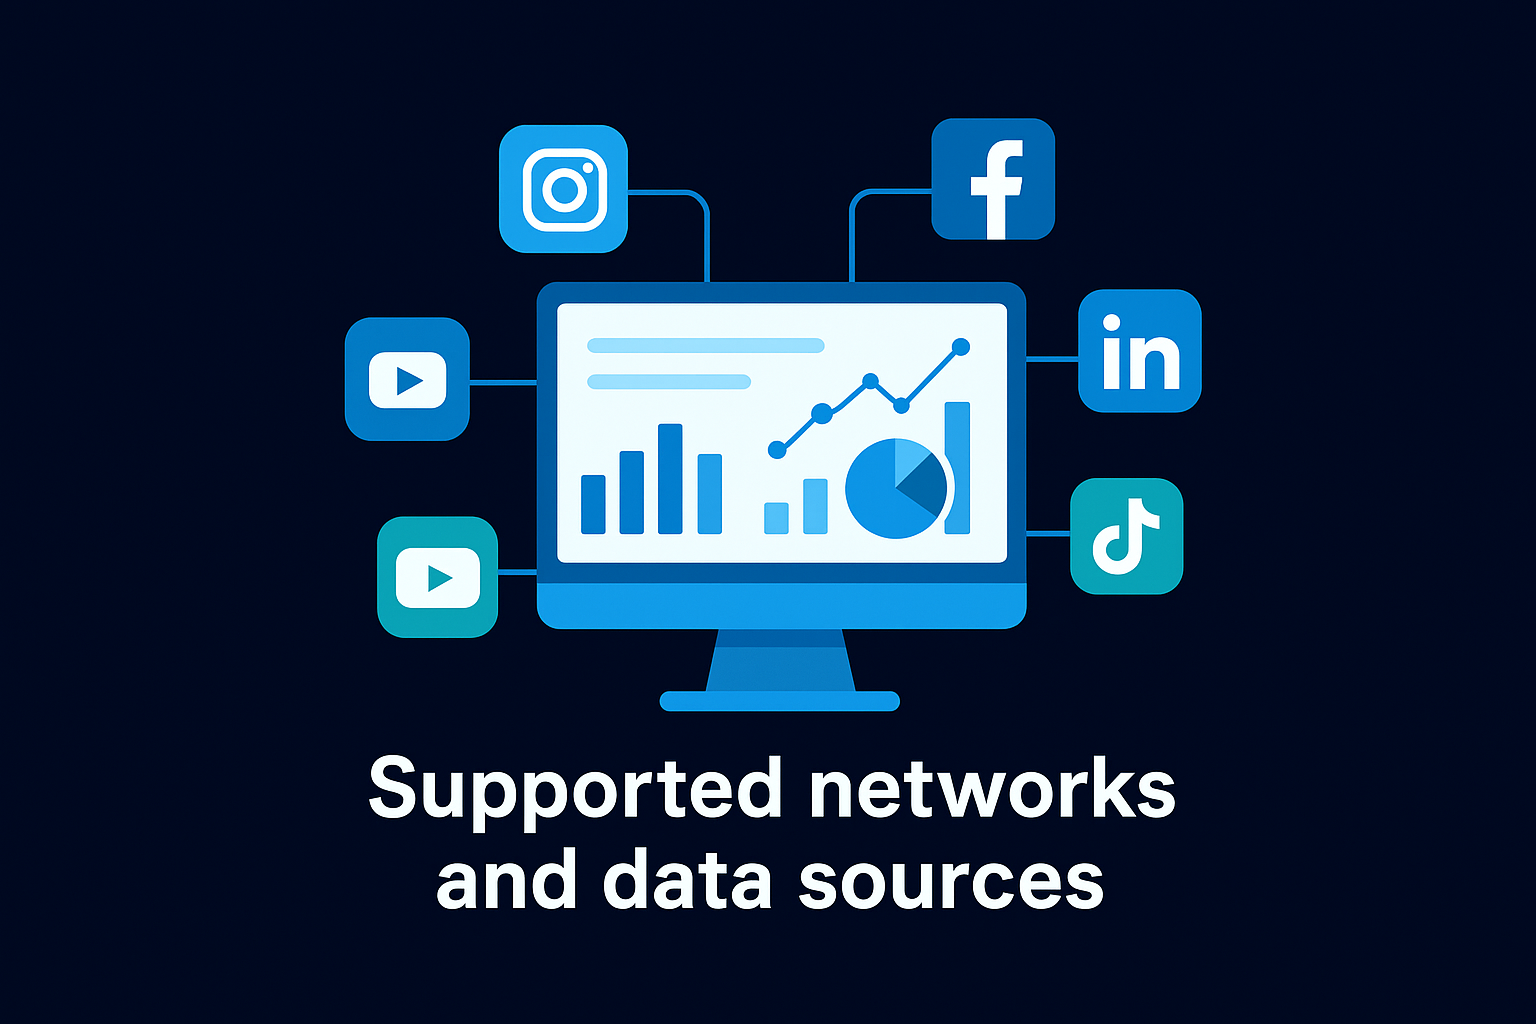
Supported networks and data sources
Hootsuite connects to the major social platforms and pulls in performance data directly through each platform's official API. Instagram, Facebook, Twitter/X, LinkedIn, YouTube, TikTok, and Pinterest are all supported, though the depth of available data varies by network. Instagram provides granular story and reel metrics, while Pinterest focuses primarily on impressions and saves. The variation matters when you're building reports, because not every metric is available on every platform.
The breadth of network support matters because your audience doesn't live on one platform, and your reporting infrastructure shouldn't either.
Here's a quick overview of what Hootsuite pulls in from key platforms:
| Platform | Key Data Types |
|---|---|
| Reach, impressions, engagement, story views, reel plays | |
| Page reach, post engagement, link clicks, follower growth | |
| Impressions, clicks, engagement rate, follower demographics | |
| YouTube | Views, watch time, subscribers gained, click-through rate |
| TikTok | Video views, likes, shares, profile visits |
Report types and dashboard features
Hootsuite gives you access to pre-built report templates and fully customizable dashboards within the same interface. Pre-built reports cover standard use cases like overall account performance, best times to post, and team productivity tracking, so you can generate useful outputs quickly without configuring everything manually. These templates suit teams that need consistent, recurring reports without spending time on layout decisions every reporting cycle.
Custom dashboards go further by letting you select specific metrics, set precise date ranges, and compare performance across multiple profiles simultaneously. You can arrange visual tiles, pull data from different networks side by side, and export finished reports as PDFs or CSV files for sharing with leadership or clients. This flexibility makes the analytics layer genuinely functional beyond internal check-ins. Whether you're proving campaign ROI or identifying which content format drives the most profile visits, the reporting tools give you the structure to answer those questions with real numbers.
How Hootsuite Analytics works behind the scenes
Understanding the mechanics behind Hootsuite Analytics helps you interpret your data more accurately and troubleshoot gaps when numbers don't match what you see in a native platform dashboard. The system is built on three core layers: data retrieval, normalization, and visualization. Each layer plays a specific role in turning raw platform signals into the structured reports you actually use to make decisions.
API connections and data retrieval
Hootsuite connects to each social network using that platform's official API (Application Programming Interface). When you authorize a social account inside Hootsuite, you're granting the platform permission to request performance data on your behalf through that API connection. Hootsuite then pulls this data on a scheduled basis, typically at regular intervals throughout the day, depending on the network's API refresh rate.
The data you see in Hootsuite is only as current as the platform's API allows, which is why some metrics can lag by several hours after a post goes live.
This dependency on external APIs also explains why certain metrics disappear or change after a platform updates its API structure. When Meta, LinkedIn, or TikTok modify what data they expose through their APIs, Hootsuite has to update its integration to match, which can create temporary gaps in historical data or available metric types.
Data normalization across platforms
Each social platform uses its own definitions and terminology for similar concepts. What Instagram calls "reach" and what LinkedIn calls "impressions" are not the same thing, and a raw comparison between the two would be misleading. Hootsuite's backend maps each platform's native metric labels to a standardized taxonomy so that the data becomes comparable within your dashboards.
This normalization layer is what makes cross-platform reporting functional rather than decorative. Without it, you'd still be manually reconciling different metric definitions every time you tried to compare results across networks. The system handles that translation automatically so your reports reflect consistent logic across every channel you're tracking.
How data flows into your reports
Once the data is retrieved and normalized, Hootsuite stores it in its own database and feeds it into the dashboard and report builder interface you interact with directly. When you set a date range or filter by account, you're querying that stored dataset rather than making a live call to each platform in real time. This architecture keeps report generation fast and allows you to access historical data even if your native platform access changes.
Key metrics and definitions you should know
Before you build reports or draw conclusions from your data, you need a clear understanding of what each metric actually measures. Misreading a metric is one of the most common ways social teams end up with confident but wrong conclusions. Hootsuite Analytics uses standard industry terminology, but several of these terms are frequently confused with each other, and conflating them will distort your performance picture fast.
Reach and impressions
These two terms appear in nearly every social report, and they are not interchangeable. Reach refers to the number of unique accounts that saw your content at least once. Impressions count the total number of times your content was displayed, including multiple views from the same person. If one person sees your post three times, that counts as 1 in reach and 3 in impressions.
Tracking impressions without reach tells you how often content is seen, but not how many distinct people you're actually putting your brand in front of.
Reach is typically the more meaningful metric for audience growth goals, while impressions give you a better read on content frequency and distribution behavior.
Engagement metrics
Engagement covers every action a viewer takes on your content, including likes, comments, shares, saves, and link clicks. The raw number matters less than engagement rate, which expresses those actions as a percentage of reach or impressions. A post with 500 likes on a 500-person reach is performing very differently than the same 500 likes spread across 50,000 people.
Different platforms weight engagement actions differently. Saves on Instagram carry a different algorithmic signal than a comment on LinkedIn. When you review engagement data inside your reports, break it down by action type rather than treating total engagement as a single number.
Conversion and click metrics
Click-through rate (CTR) measures how often someone who sees your content actually clicks a link within it. This metric directly connects your content performance to downstream behavior like website visits or landing page conversions. Link clicks give you the raw count, while CTR gives you the proportional signal that adjusts for how many people saw the post in the first place.
For teams running content with a clear call to action, CTR is the metric that closes the loop between social visibility and business outcomes. Tracking it consistently lets you identify which content formats and messaging angles actually convert attention into action.
Metrics Hootsuite tracks on each social network
Not every platform exposes the same data, and Hootsuite Analytics reflects that reality by pulling whatever each network's API makes available. Before you build cross-channel reports, it helps to know exactly what you're working with on each platform so you don't end up comparing metrics that don't translate across networks.
Instagram and TikTok
Instagram gives you one of the deepest metric sets available through Hootsuite, covering reach, impressions, engagement rate, reel plays, story views, saves, and profile visits. These metrics let you track both top-of-funnel visibility and the behavioral signals that indicate genuine audience interest. TikTok data includes video views, likes, shares, comments, and profile visits, though the platform's API is more restrictive than Instagram's, so some advanced breakdowns require additional platform-level verification before they appear in your reports.
Reel plays and TikTok video views tell you how often your content is being watched, but saves and shares tell you how much your audience values it enough to act on it.
LinkedIn and Facebook
LinkedIn is particularly useful for B2B content performance tracking because it surfaces impressions, clicks, engagement rate, follower growth, and demographic breakdowns by job title, industry, and seniority level. These filters give you a clearer picture of whether your content is reaching the right professional audience, not just a large one. Facebook data in Hootsuite covers page reach, post engagement, link clicks, reactions, and follower growth, making it straightforward to monitor both organic visibility and audience interaction trends across your reporting period.
Here's a quick breakdown of key metrics by network:
| Network | Notable Metrics |
|---|---|
| Reach, impressions, reel plays, saves, story views | |
| TikTok | Video views, shares, profile visits, comments |
| Impressions, clicks, engagement rate, follower demographics | |
| Page reach, reactions, link clicks, follower growth | |
| YouTube | Views, watch time, CTR, subscribers gained |
| Impressions, saves, outbound clicks, pin engagement |
YouTube and Pinterest
YouTube provides watch time and click-through rate data directly inside Hootsuite, which are the two metrics that most directly signal whether your video content holds attention and drives action. Subscribers gained during a specific time window also appears in your reports, giving you a clean growth signal tied to individual content cycles. Pinterest surfaces impressions, saves, and outbound clicks, which matter most if you're using the platform to drive traffic to a website or product page rather than building in-platform engagement.
How to build reports and dashboards in Hootsuite
Hootsuite Analytics gives you two main paths for reporting: using pre-built templates for fast, structured outputs or building custom dashboards that reflect exactly what you need to track. Both options live inside the Analytics tab of your Hootsuite account, and understanding when to use each one will save you time and produce cleaner results for stakeholders.
Starting with a pre-built report
Pre-built reports are the fastest way to get structured performance data without spending time on configuration. Inside the Analytics tab, navigate to the Reports section and select from the available templates. Common options include an overview report that aggregates performance across all connected accounts, a best time to post report, and a team activity summary for managers tracking content output.
Pre-built templates work well for recurring reporting cycles because the layout stays consistent, which makes period-over-period comparisons straightforward without rebuilding your structure each time.
Once you select a template, set your date range using the date picker at the top of the report. You can compare the current period against a previous one to identify trends. After the data loads, you can export the report directly as a PDF by clicking the export button in the upper right corner.
Building a custom dashboard
Custom dashboards give you full control over which metrics appear, how they're grouped, and which accounts are included in each view. To create one, go to Analytics, select Dashboards, and click the button to add a new dashboard. From there, you add individual tiles, each representing a specific metric or visualization pulled from your connected accounts.
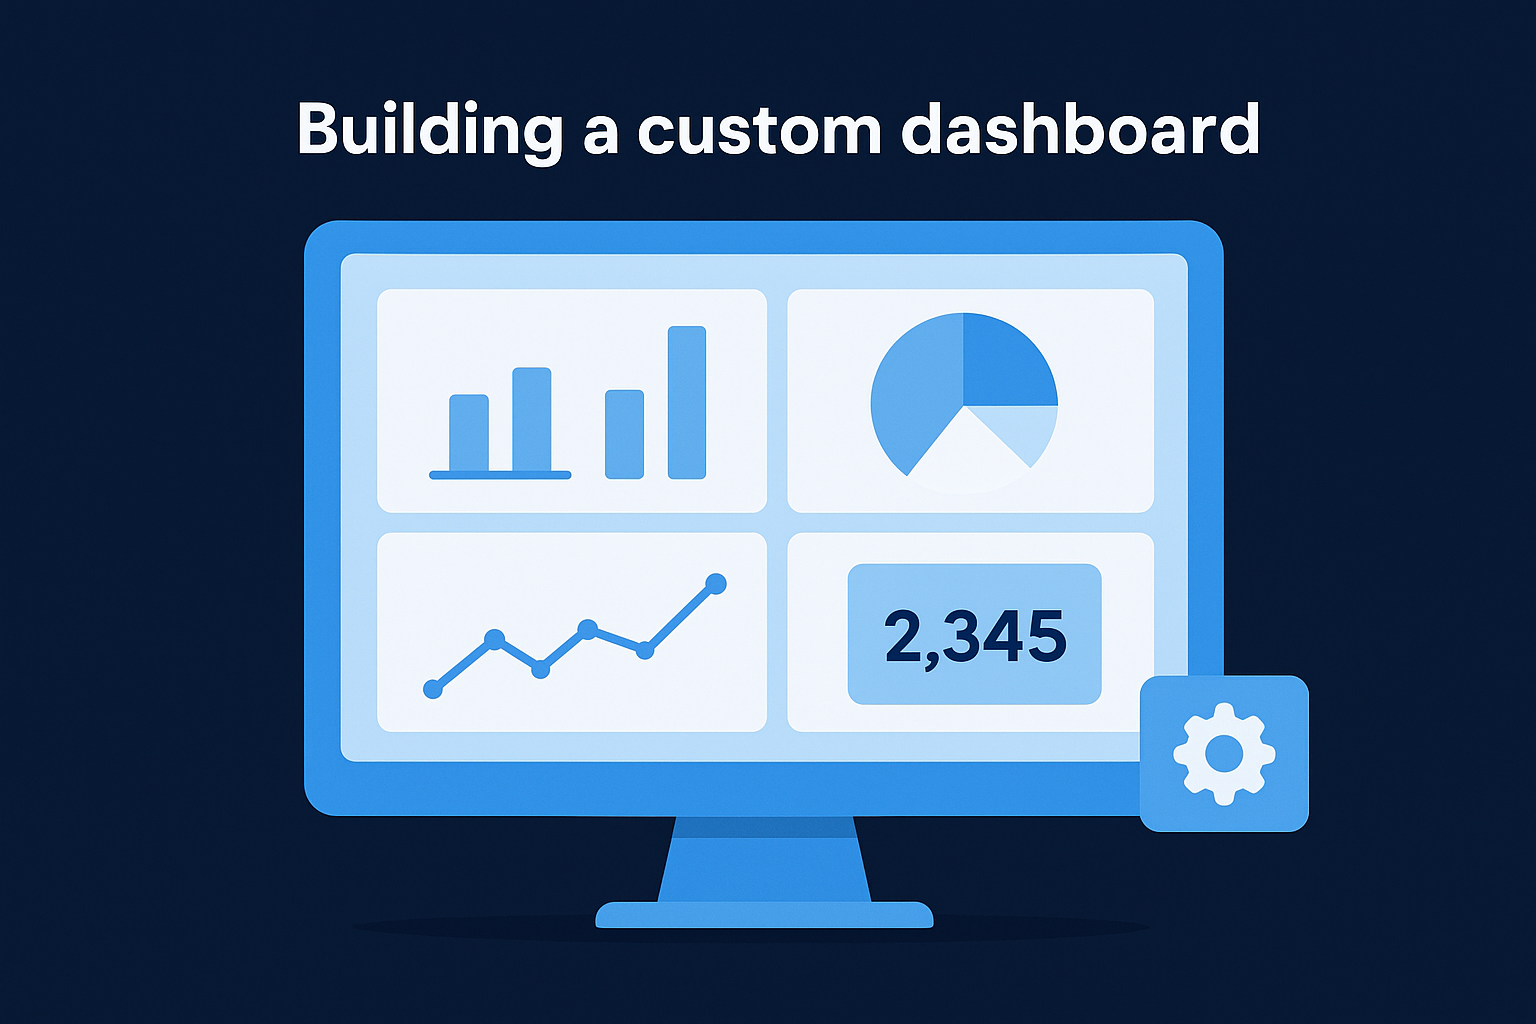
Each tile lets you choose the data source, metric type, and visualization format (bar chart, line graph, or numeric summary). You can add multiple tiles side by side to compare performance across platforms or time periods in a single view. Custom dashboards are particularly useful when you're tracking a specific campaign or comparing two content formats against each other.
Exporting and sharing your reports
Once your report or dashboard is ready, Hootsuite lets you export the data as a PDF or CSV file depending on what your stakeholder needs. PDF exports are clean enough for leadership presentations, while CSV files give analysts raw data they can work with in their own tools. You can also schedule automated report delivery by email on a recurring basis, which removes the manual step of generating and sending reports every week.
How to use analytics to improve content and ROI
Hootsuite Analytics gives you the raw material to make better content decisions, but the data only becomes useful when you apply it to a repeatable improvement cycle. The goal is not to admire your numbers but to translate performance signals into specific changes to your content strategy, posting behavior, and resource allocation. Most teams look at analytics after the fact; the smarter move is building it into your process before the next content cycle begins.
Use top-performing content as a repeatable template
Your best-performing posts are not accidents. They tell you something specific about what your audience responds to, whether that's a particular hook structure, content format, topic angle, or posting time. Pull your top 10 posts by engagement rate over the last 90 days and look for the common variables. If three of your top five LinkedIn posts open with a direct question, that's a signal worth repeating deliberately, not just once.
The data in your analytics account is essentially a tested brief for your next piece of content, one that your audience already validated.
From there, build a simple content matrix that maps high-performing formats against the audience segments they reached. This gives your team a structured starting point for content planning rather than beginning from intuition every cycle.
Tie posting behavior to business outcomes
Engagement is useful, but revenue-relevant metrics like click-through rate and link clicks are the ones that connect social performance to actual business results. Use your analytics data to identify which content types consistently drive clicks to your website or conversion pages. Then adjust your content mix to prioritize those formats, while keeping engagement-focused posts in rotation to maintain algorithmic reach.
Tracking these conversion metrics on a month-over-month basis helps you spot when a format starts to decline in effectiveness. When CTR drops on a content type that used to perform well, that's your signal to test a new angle rather than repeat a format that's losing traction with your audience.
Set benchmarks before you evaluate campaigns
Before you launch any campaign, set clear baseline benchmarks using your historical average metrics. Without a baseline, you have no reliable way to evaluate whether a campaign actually performed or simply generated activity. Pull your three-month averages for reach, engagement rate, and CTR, and treat those numbers as your floor, not your ceiling, when setting campaign targets.
Benchmarks also give you a defensible framework when leadership asks whether a campaign delivered. Pointing to a specific lift above your established baseline is a much stronger answer than presenting raw numbers with no context behind them.
Hootsuite Analytics pricing, add-ons, and limits
Hootsuite Analytics access is tied directly to your plan tier, which means the depth of reporting available to you changes significantly depending on what you're paying for. Understanding where the limits sit before you commit to a plan prevents the frustration of building a reporting workflow only to discover that a critical feature requires an upgrade.
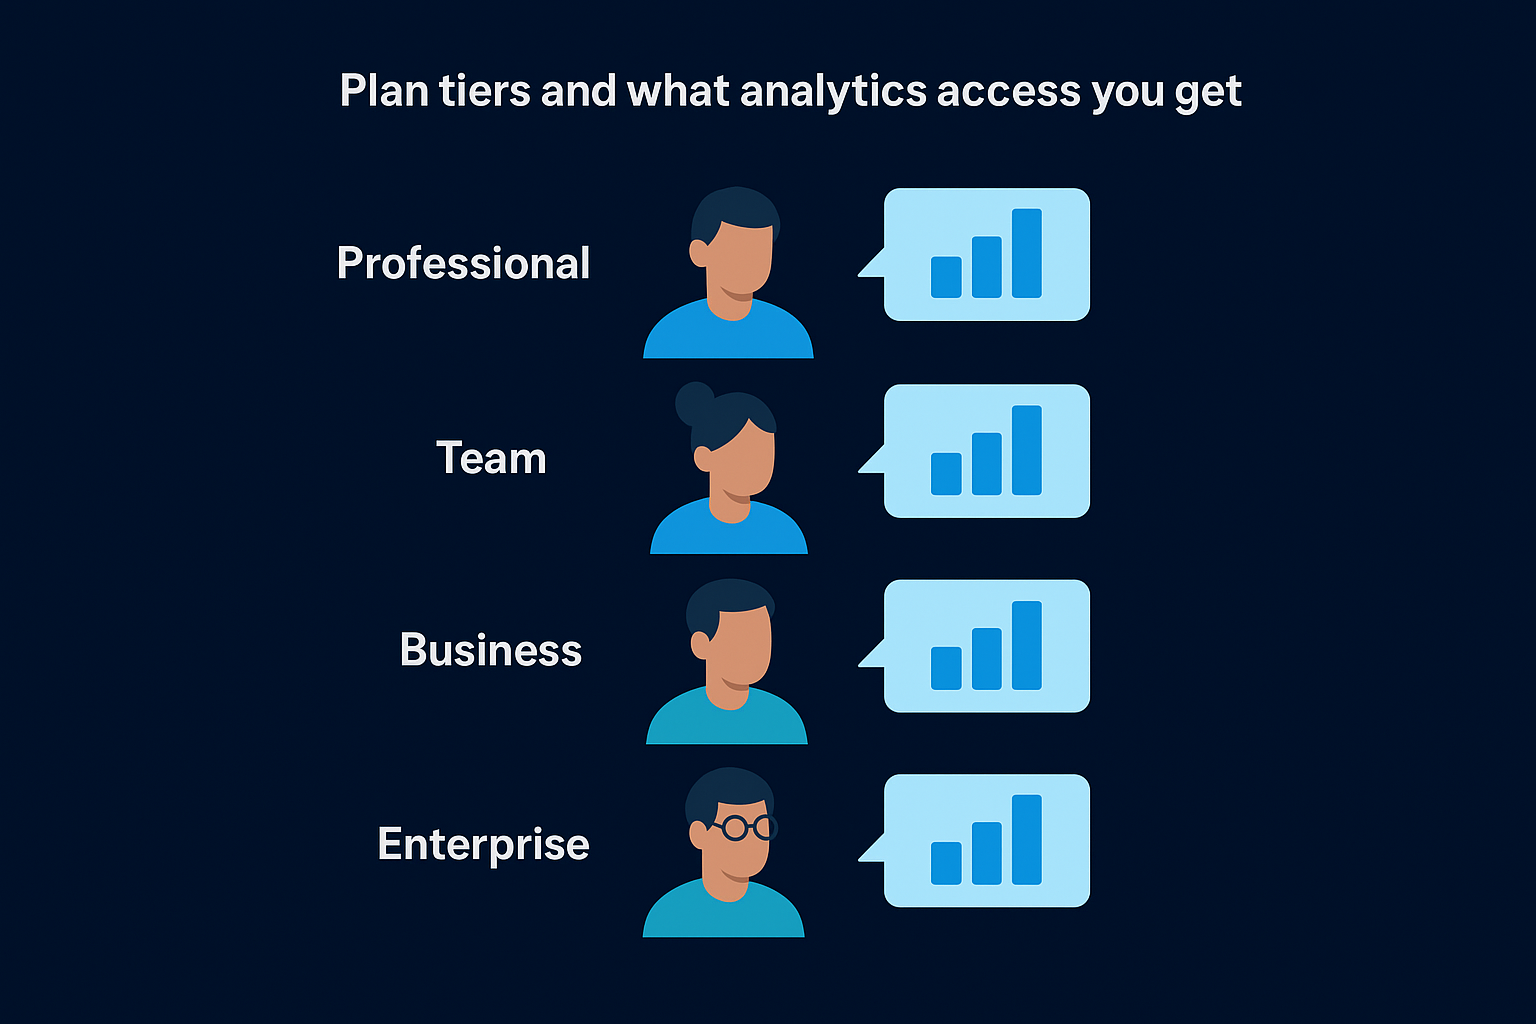
Plan tiers and what analytics access you get
Hootsuite offers several plan levels, and analytics functionality scales with each tier. The Professional plan gives one user access to basic performance reports and a limited selection of pre-built templates, which suits individual creators or small accounts running a single brand. The Team plan expands access to more report types and shared reporting visibility, supporting up to three users and making it more appropriate for small marketing teams that collaborate on content performance reviews.
The gap between the Professional plan and the Team plan is significant if your workflow depends on collaborative reporting or custom dashboard features.
Business and Enterprise plans unlock the full analytics suite, including advanced custom dashboards, extended historical data access, and deeper cross-channel comparisons. Enterprise accounts also gain access to dedicated support and custom onboarding, which matters if you're managing a large network of social accounts across multiple brands or regions.
Here is a general overview of how analytics access maps to plan level:
| Plan | Analytics Access |
|---|---|
| Professional | Basic reports, limited templates, 1 user |
| Team | More report types, shared dashboards, 3 users |
| Business | Full custom dashboards, extended history, 5+ users |
| Enterprise | Complete suite, custom integrations, dedicated support |
Historical data limits and add-ons
Historical data access is one of the most important limits to evaluate before you select a plan. Lower-tier plans cap how far back you can pull data, which restricts your ability to run longer-term trend analysis or build meaningful year-over-year comparisons. If quarterly or annual reporting is part of your regular workflow, confirm the historical data window for your specific plan before assuming it covers what you need.
Paid add-ons extend specific analytics capabilities beyond what your base plan includes, covering areas like advanced social listening, competitive benchmarking, and expanded data exports. Factor these additional costs into your total budget estimate upfront if those capabilities are requirements rather than optional enhancements for your team.
Pros, cons, and who Hootsuite Analytics fits
Hootsuite Analytics sits in a competitive space alongside tools like native platform dashboards and standalone reporting software. Before you commit to a plan or build your reporting workflow around it, you need an honest read on where the platform genuinely delivers and where it creates friction for certain team structures.
Where Hootsuite Analytics performs well
The clearest advantage is consolidated cross-platform reporting inside a single interface. Instead of logging into five separate dashboards, you build one reporting layer that covers all your active channels simultaneously. The pre-built report templates also reduce setup time significantly, particularly for teams that need fast, recurring reports without rebuilding the layout from scratch every cycle.
The combination of network breadth and repeatable reporting structure is where Hootsuite Analytics creates the most consistent value for working social teams.
Scheduled report delivery and PDF exports make sharing results with leadership straightforward, which matters when you're accountable to stakeholders who don't want to log into another platform to see performance data. The interface is also relatively accessible for team members who don't have a technical background, which lowers the training overhead for new team additions.
Where the platform falls short
Pricing is the most consistent friction point, especially at the lower plan tiers where analytics access is limited. Teams that need extended historical data or full custom dashboards will need to move to higher plans, which pushes the monthly cost well beyond what smaller teams or solo creators typically budget for a social management tool. API dependencies also create moments where data lags or metrics disappear temporarily after a platform updates its integration, which can undermine reporting confidence during those windows.
The depth of competitive benchmarking and social listening features is also limited compared to dedicated analytics platforms, so teams whose primary goal is tracking industry trends or monitoring competitor performance may find the tool insufficient on its own.
Who gets the most value from Hootsuite Analytics
This tool fits best when you're managing multiple social accounts across several platforms and need a reliable way to consolidate performance data without building a custom reporting stack. Marketing teams at mid-size companies, agency account managers handling several clients, and founders scaling a brand presence across channels all have workflows that align well with what the platform provides.
Smaller operations running one or two accounts on a single platform will likely get equivalent reporting value from native analytics without the added subscription cost. The platform earns its price when the multi-channel complexity justifies the investment.
Common questions and troubleshooting
Even after you set up Hootsuite Analytics and connect your accounts, you'll likely run into situations where the numbers don't look right or a feature behaves unexpectedly. Most issues trace back to a small set of root causes, and knowing what they are saves you time before you contact support or question your entire reporting setup.
Why doesn't my data match what the native platform shows?
Discrepancies between Hootsuite and a platform's native dashboard are one of the most common sources of confusion for new users. The gap usually comes down to timing. Hootsuite pulls data through each platform's API on a scheduled interval, so your numbers may lag behind the native dashboard by several hours, particularly in the first 24 hours after a post goes live.
If your data doesn't match after 48 hours, the more likely cause is a difference in how each platform defines the metric you're comparing.
Metric definitions are not always identical between what a native dashboard labels something and how Hootsuite normalizes it for cross-platform reporting. Review the specific definition Hootsuite uses for that metric inside the platform's help documentation before concluding the data is wrong.
Why are some metrics missing or unavailable?
Missing metrics are almost always tied to API restrictions set by the social platform itself, not a bug inside Hootsuite. When a platform limits what data it exposes through its API, Hootsuite cannot pull information that the platform doesn't make available. TikTok and Pinterest are the most frequent sources of this issue because their APIs are more restrictive than Instagram's or LinkedIn's.
Account-level permissions also affect what data appears. If the social account connected to Hootsuite doesn't have the right access level (for example, a personal Instagram account versus a Business or Creator account), certain metrics will simply not appear in your reports. Switch the account to a business profile on the native platform first, then re-authenticate the connection inside Hootsuite.
How do I fix a broken account connection?
When an account shows as disconnected or stops pulling fresh data, the fix is usually a token refresh rather than a full reconnection. Go to your account settings in Hootsuite, find the affected social profile, and re-authorize the connection. Expired access tokens are the most common cause, and platforms periodically require re-authentication as a security measure, so this is a routine step rather than a sign of a larger problem.
Wrap-up
Hootsuite Analytics gives your team a reliable way to consolidate performance data across every major social platform, build repeatable reports, and make content decisions based on actual evidence rather than instinct. From understanding the difference between reach and impressions to knowing which plan tier unlocks the historical data your workflow depends on, this guide covered the full scope of what the platform offers and where it fits best.
Data is only as useful as the system you build around it. If you're managing social media for a brand that needs more than a reporting tool, and you want a complete content engine that turns analytics into consistent audience growth and inbound revenue, that's exactly what we build at SocialRevver. You get strategy, production, and distribution working as one system. Apply to work with our team and get your free 40+ slide social media strategy to see what a data-driven content system looks like for your specific brand.