
TikTok moves fast, and if you're not measuring what's working, you're essentially throwing content into a void. Sprout Social TikTok analytics gives you a centralized way to track video performance, audience behavior, and engagement trends, all without jumping between multiple dashboards. For founders, creators, and business owners who treat content as a growth lever rather than a guessing game, having this data at your fingertips changes everything.
But here's the thing: analytics tools only matter if you know what to do with the data. At SocialRevver, we build content systems that are driven by performance data, analyzing hundreds of thousands of videos to identify what actually converts attention into revenue. Sprout Social is one of the platforms that can feed that kind of strategic thinking, and understanding how to use it properly puts you miles ahead of competitors who post and pray.
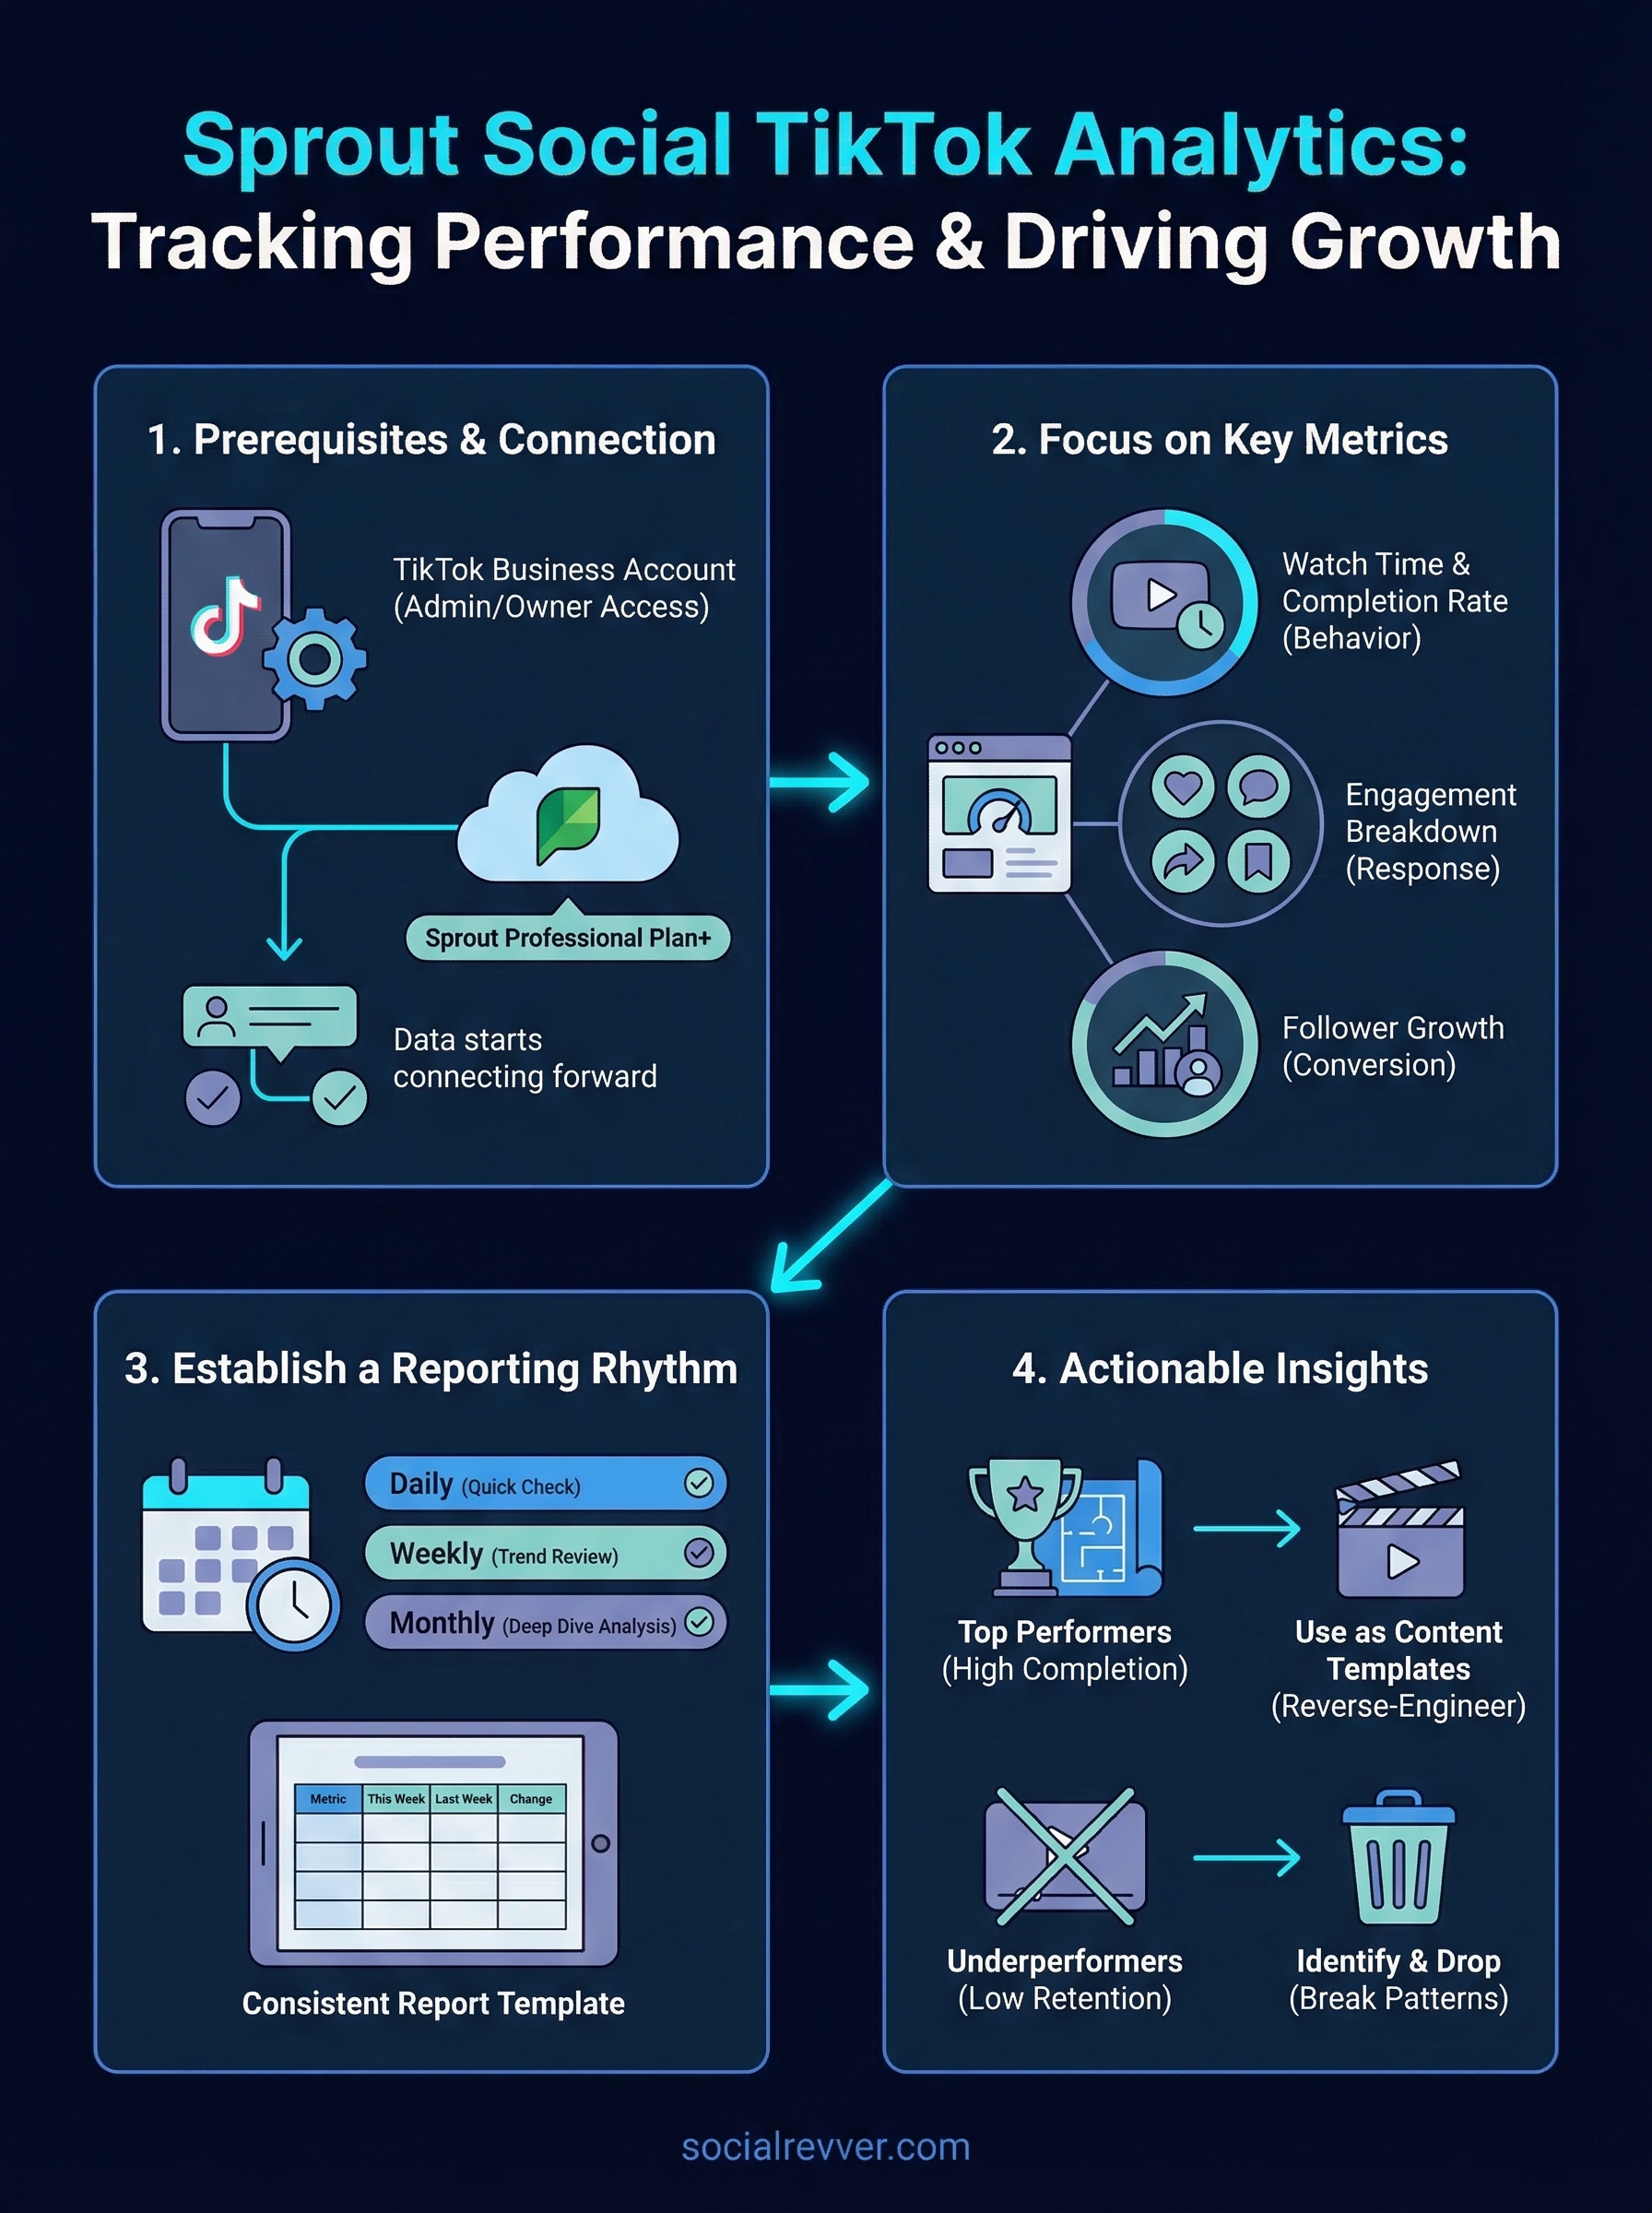
This guide walks you through how to set up Sprout Social for TikTok tracking, which metrics deserve your attention, and how to turn raw numbers into actionable decisions. Whether you're managing your own brand or overseeing a team, you'll leave with a clear framework for using Sprout Social to improve your TikTok performance consistently.
What you need before you track TikTok in Sprout
Before you dive into Sprout Social TikTok analytics, there are a few prerequisites that determine whether you can access data at all. Skipping this checklist is one of the most common reasons people get stuck after signing up, only to find that certain reports are grayed out or metrics aren't populating. Getting these pieces in place upfront saves you time and frustration later.
The right Sprout Social plan
Not every Sprout Social plan includes TikTok analytics. Access to TikTok reporting is available on the Professional plan and above, which means if you're on the Standard plan, you won't see TikTok-specific data in your reports. Before you start connecting accounts or building dashboards, confirm your current plan in your Sprout account settings under Billing.
Upgrading your plan just to access TikTok data is worth evaluating against your content investment. If TikTok is a serious channel for your brand, the reporting access pays for itself quickly.
Your plan also controls how many connected social profiles you can manage at once. Each TikTok account you want to track counts as one profile slot, so if you manage accounts for multiple clients or brands, confirm you have enough available slots before you begin the connection process.
TikTok account requirements
Your TikTok account needs to meet a few conditions before Sprout can pull data from it. First, the account must be a TikTok Business Account, not a personal one. Sprout connects through TikTok's official API, which only supports business accounts. If your account is currently personal, you can switch it to a business account directly inside the TikTok app settings under "Manage Account."
Second, you need to be an admin or owner of the TikTok account you want to connect. Sprout requires proper authorization credentials during the connection process, so editor-level access on TikTok is not sufficient. If you're setting this up for a client, confirm they've added you with the right permissions before you start.
Here's a quick checklist to run through before moving forward:
- TikTok account type is set to Business Account
- You have admin or owner access to the account
- Your Sprout Social plan is Professional or higher
- You have an available profile slot in your Sprout plan
- Two-factor authentication is active on both accounts
Data availability and historical limits
Once you connect your TikTok account, Sprout will not immediately populate months of historical data. Sprout Social pulls TikTok data from the connection date forward, meaning older content performance won't be retroactively imported. This is a TikTok API limitation, not a Sprout issue, and it applies to all third-party platforms that connect through TikTok's official channels.
Practically, this means the sooner you connect your account, the more cumulative data you'll build over time. If you're planning a content push or launching a new campaign, set up your Sprout connection before you start posting. Waiting costs you baseline performance data that would otherwise help you benchmark every decision going forward.
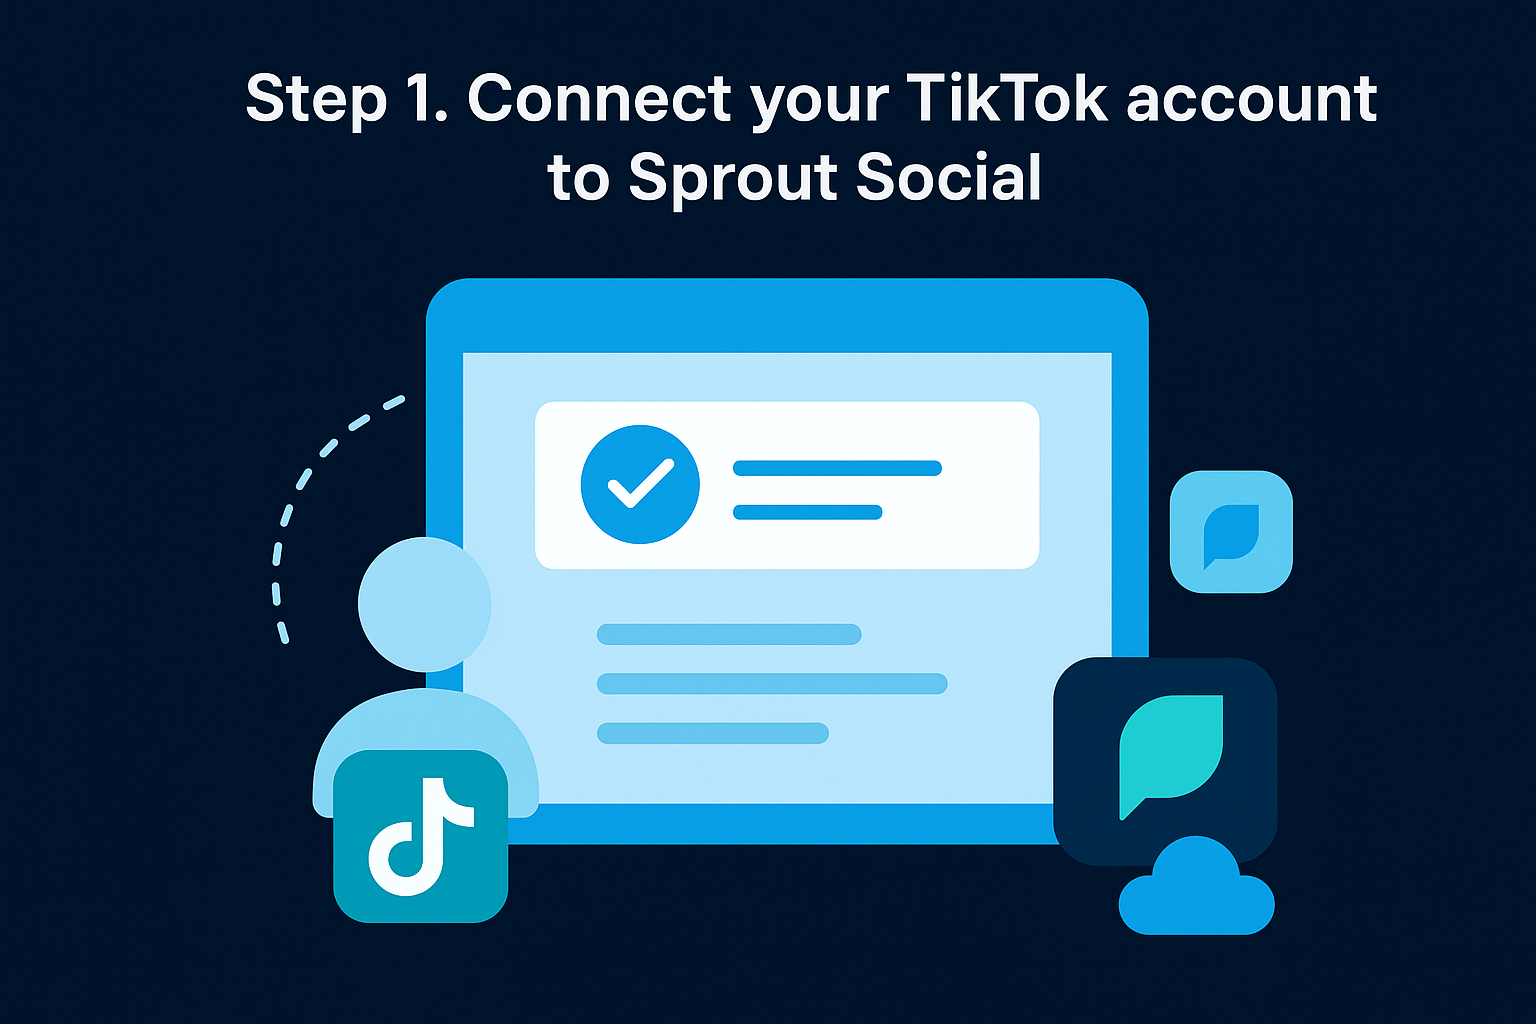
Step 1. Connect your TikTok account to Sprout Social
With your account requirements confirmed, you're ready to connect TikTok inside Sprout. The connection process takes about five minutes, but the order of steps matters. Rushing through it or skipping the authorization window can cause errors that force you to start over, and repeating the process wastes time you could spend analyzing data.
Navigate to the profile connection settings
Log into your Sprout Social dashboard and click your account name or profile icon in the top-right corner. From the dropdown, select "Settings," then go to "Connected Accounts" in the left sidebar. This is where all your social profiles live, including any new ones you want to add.
On the Connected Accounts page, click "Add a Social Profile." A panel will appear listing every platform Sprout supports. Select TikTok from the list to kick off the authorization flow.
Authorize TikTok access
Sprout will redirect you to TikTok's official login page to complete the authorization. Sign in with the credentials tied to the Business Account you set up earlier. Once you log in, TikTok shows a permissions screen listing exactly what data Sprout is requesting, which typically includes profile information, video data, and performance analytics.
Click "Confirm" on every permission TikTok presents. Denying even one can block Sprout from pulling the full data set you need for accurate reporting.
After confirming, TikTok sends you back to Sprout, and your account appears in the Connected Accounts list within seconds. A green status indicator confirms the connection is active. If you see an error instead, the most likely cause is insufficient admin access on the TikTok side, so check your account permissions before retrying.
Confirm data is flowing
Once the account shows as connected, go to Reports in the left navigation panel and open the TikTok profile report. Give it a few minutes to populate. If your account has recent posting activity, you should start seeing video-level data and engagement figures load in. This is where Sprout Social TikTok analytics begins giving you usable insight.
If the report stays blank after 10 minutes, try these fixes in order:
- Disconnect the TikTok account from Connected Accounts
- Clear your browser cache and reload Sprout
- Reconnect the account and approve all permission requests without skipping any
- Confirm your TikTok account is still set to Business Account in the TikTok app
Step 2. Find the TikTok metrics that matter
Once your data is flowing into Sprout, the next challenge is knowing which numbers to focus on. TikTok's native app and Sprout's reporting panel both surface dozens of metrics, and most of them won't tell you anything useful on their own. Your goal is to build a short list of performance indicators that connect directly to your content goals, whether that's building authority, driving profile traffic, or generating inbound leads.
The biggest mistake brands make in analytics is tracking metrics that feel good instead of metrics that drive decisions. Vanity numbers look impressive in screenshots but rarely tell you what to do next.
Watch time and video completion rate
These two metrics are the most telling signals in sprout social tiktok analytics because they measure actual viewer behavior, not just passive exposure. Average watch time shows how many seconds viewers stayed with your video before scrolling away, while video completion rate shows the percentage who watched all the way to the end. A video with 50,000 views but a 10% completion rate is underperforming. A video with 8,000 views and a 70% completion rate is a model worth repeating.
Inside Sprout, you can sort your video list by completion rate to identify your top performers quickly. Look for patterns in video length, hook structure, and topic across the videos with the highest completion rates. Those patterns become your production blueprint.
Engagement breakdown
Engagement on TikTok is not a single number. Sprout breaks it into individual interaction types so you can see exactly how people responded. Here's what each metric signals:
| Metric | What it tells you |
|---|---|
| Likes | Content resonated emotionally |
| Comments | Content triggered a reaction worth saying out loud |
| Shares | Content was worth sending to someone else |
| Saves | Content had reference or rewatch value |
Shares and saves carry the most weight for organic reach and authority-building because they signal that viewers found the content genuinely useful or worth returning to.
Follower growth tied to content
Track net follower change alongside your posting activity inside Sprout. When you correlate follower spikes with specific videos, you identify which content formats actually convert viewers into long-term audience members rather than one-time watchers. That insight is what separates a content strategy from a content calendar.
Step 3. Build a reporting workflow you can repeat
Raw data sitting in a dashboard is worthless unless you build a regular process for reviewing and acting on it. The goal of sprout social tiktok analytics is not just to collect numbers but to create a rhythm where you pull the same metrics at the same intervals, spot trends over time, and make faster decisions as a result. Without a fixed workflow, analytics becomes reactive instead of strategic.
Set a fixed reporting cadence
Most brands check their analytics too irregularly to catch meaningful patterns. Set a weekly and monthly review schedule so you always know where you stand and can separate short-term noise from actual trend shifts. Here is a cadence that works for most content-driven brands:
- Daily (5 minutes): Check video views and early engagement on content posted in the last 48 hours
- Weekly (20 minutes): Review watch time, completion rates, and net follower change for the past 7 days
- Monthly (45 minutes): Analyze your top 5 and bottom 5 videos by completion rate, identify patterns, and adjust your content plan for the following month
Reviewing data on a fixed schedule forces you to compare against your own baseline rather than chasing industry benchmarks that may not apply to your audience.
Build a repeatable report template
Using the same report structure every cycle lets you spot changes immediately instead of rebuilding your analysis from scratch each time. Inside Sprout, you can save custom report templates and share them with your team so everyone pulls the same data in the same format. Here is a simple template to standardize your weekly TikTok review:
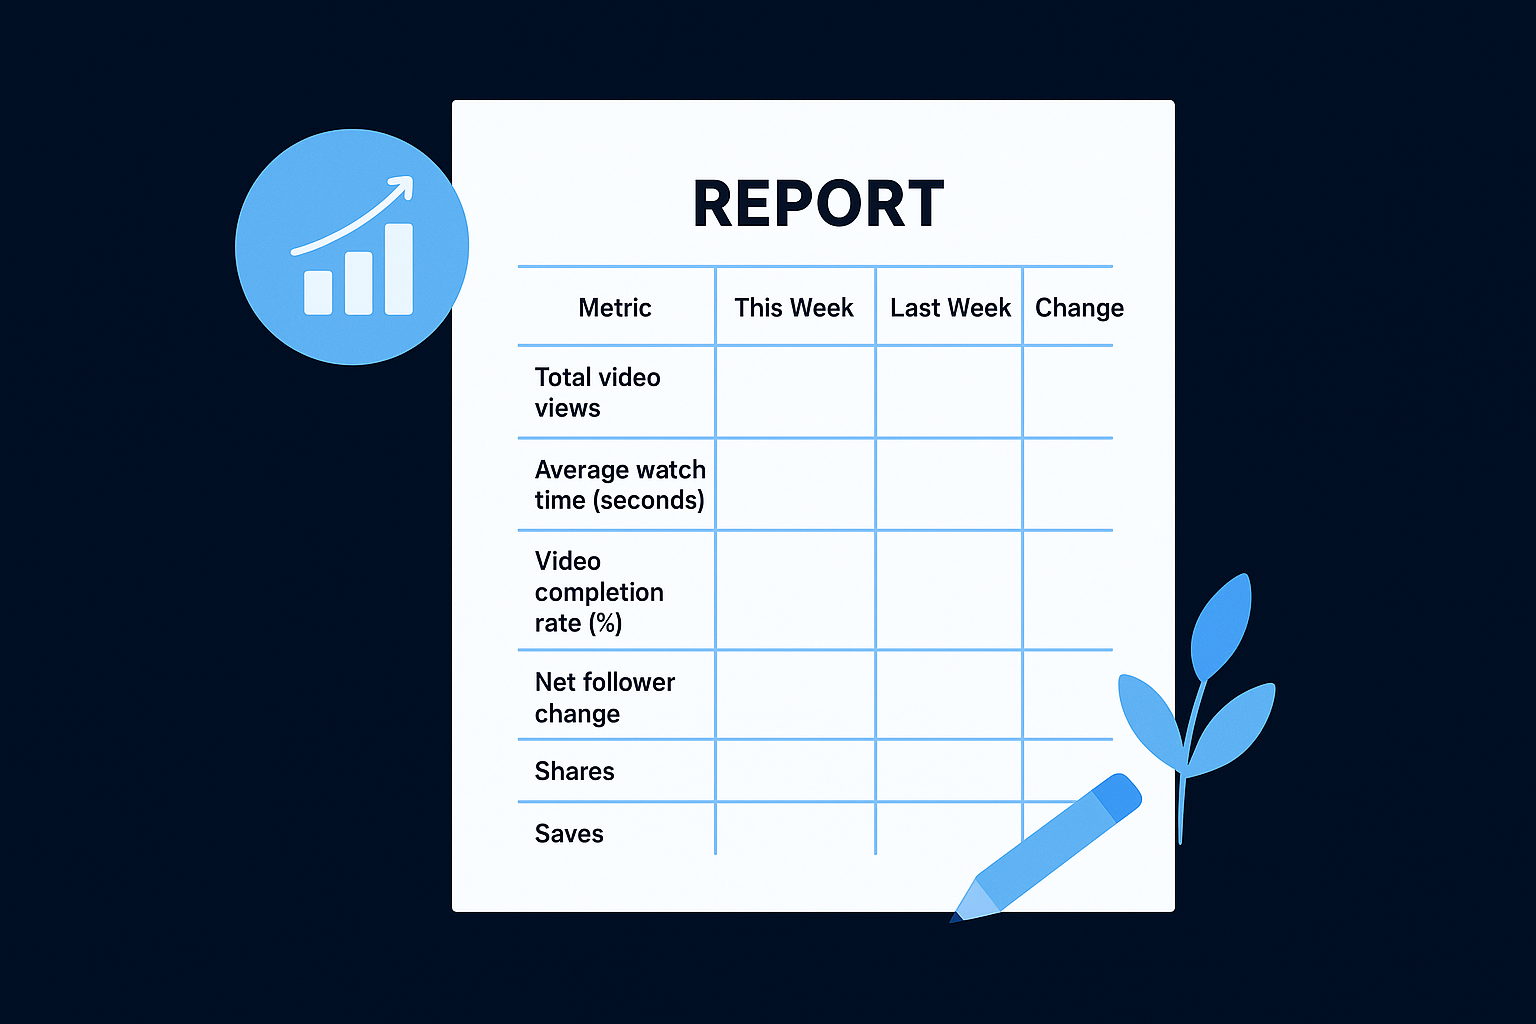
| Metric | This Week | Last Week | Change |
|---|---|---|---|
| Total video views | |||
| Average watch time (seconds) | |||
| Video completion rate (%) | |||
| Net follower change | |||
| Shares | |||
| Saves | |||
| Top performing video |
Fill in this table each week directly from your Sprout Social reports panel. Over four to six weeks, you will have enough baseline data to see which content formats are trending up and which ones are losing traction, giving you a concrete basis for every production decision you make.
Step 4. Turn analytics into content and growth actions
Analytics only create value when they change what you produce next. The entire point of using sprout social tiktok analytics is to close the loop between data and decisions, so your next video is smarter than your last one. Reviewing numbers without adjusting your content plan is just record-keeping, and record-keeping does not grow a brand.
Use your top performers as content templates
Your highest-completion-rate videos are not accidents. They are repeatable formulas that tell you exactly what your audience responds to in terms of hook style, video length, topic framing, and pacing. Once you identify your top three to five videos by completion rate over a 30-day period, break each one down into its structural components.
Your best-performing video is a blueprint, not a one-time win. Reverse-engineer it and rebuild it with a fresh angle.
Use this breakdown template each time you identify a top performer:
| Element | What to document |
|---|---|
| Hook (first 3 seconds) | Question, bold statement, or visual pattern used |
| Video length | Total seconds and drop-off point from watch time data |
| Topic angle | Specific problem addressed or emotion triggered |
| Call to action | What you asked viewers to do at the end |
| Format | Talking head, text overlay, B-roll, or mixed |
Filling in this table for each standout video gives you a production brief you can hand to a scriptwriter or editor without any guesswork.
Identify and drop what isn't working
Low-completion videos and stagnant follower periods carry just as much information as your wins. Look inside Sprout for videos where watch time drops below 30% of the total length. That cutoff signals that the hook or opening structure failed to hold attention, regardless of how strong the rest of the content was.
From those underperforming videos, look for shared patterns: similar video lengths, the same topic category, or a specific visual format that consistently loses viewers. Once you confirm a pattern across three or more videos, that format or topic has earned its removal from your content plan. Redirecting that production effort into formats your data already validates is the fastest path to compound growth on TikTok.
Next steps
You now have a complete process for using sprout social tiktok analytics to track what matters, build a repeatable reporting rhythm, and turn performance data into better content decisions. The framework in this guide only works if you actually implement it. Start by connecting your TikTok Business Account to Sprout today and let data accumulate from this point forward, because every week you wait is baseline data you'll never recover.
From there, run your first weekly review using the template from Step 3. Pick your top performer from the last 30 days, reverse-engineer its structure using the breakdown table in Step 4, and build your next three videos around that format. Consistent iteration on proven patterns is what separates brands that grow from brands that plateau.
If you want a complete content system built around this kind of data-driven approach, get your free 40+ slide social media strategy from the SocialRevver team.