
Knowing what's working on social media and what isn't is the difference between growing strategically and guessing. Sprout Social social media analytics gives marketing teams and brand leaders a centralized way to track performance, measure ROI, and make smarter decisions about content, but only if you know how to use it. The platform packs a serious amount of reporting power, and most users barely scratch the surface.
At SocialRevver, we build data-driven content systems that turn short-form video into a predictable growth engine for founders, creators, and business owners. Analytics platforms like Sprout Social feed directly into the kind of work we do every day, identifying what resonates, doubling down on high-performance patterns, and eliminating guesswork from content strategy. We've spent enough time inside these tools to know exactly where they shine and where they fall short.
This guide breaks down Sprout Social's core analytics features, the reports you'll actually use, and how to pull actionable insights from your data instead of just staring at dashboards. Whether you're evaluating Sprout Social as a potential tool for your team or trying to get more out of a subscription you're already paying for, this article gives you a clear, practical walkthrough of everything the platform offers on the analytics side.
Why Sprout Social analytics matters for growth
Most social media teams spend the majority of their time creating and publishing content, then crossing their fingers. Engagement numbers go up and down, but without a structured way to read the data, you have no reliable way to know why something worked or how to repeat it. Sprout Social analytics changes that dynamic by giving you a consistent, structured view of performance across every platform you manage, so decisions are driven by evidence rather than instinct.
The cost of running without data
When you post without measuring, you're essentially running a marketing budget on guesswork. You might notice a video did well, but you won't know whether it was the format, the posting time, the hook, or the audience segment that made the difference. Over time, that uncertainty compounds. You end up spending time on content formats that don't convert, ignoring the ones that do, and missing repeatable patterns that could fundamentally improve your results.
The teams that grow consistently aren't the ones creating the most content. They're the ones learning the fastest from what they publish.
Sprout Social gives you a structured way to break that cycle. Instead of checking raw platform data across five separate native dashboards, you get one consolidated view that makes it easier to spot trends, compare time periods, and take action on what you find before the window closes.
How analytics connects content to business outcomes
The real value of Sprout Social social media analytics isn't vanity metrics. It's the ability to trace content performance back to actual business results. You can track not just how many people saw a post, but what they did after seeing it, whether they clicked through, converted, or engaged in a way that signals genuine purchase intent. That connection between content activity and revenue-driving behavior is what separates a reporting tool from a growth tool.
For founders and business owners especially, this matters at a different level. When you're building authority in a market, you need to know which content types are attracting the right audience, not just the largest one. Sprout's analytics layers let you segment performance in ways that answer those specific questions rather than giving you one flat number to interpret on your own.
Building a feedback loop that compounds
Growth on social media isn't linear. The brands and creators that scale fast are usually the ones that have built a tight feedback loop between publishing and learning. They publish, they measure, they adjust, and they repeat with better inputs each cycle. Sprout Social is built to support exactly that kind of process, giving you the data points you need to make each round of content smarter than the last.
When you use the platform consistently, your historical performance data becomes more valuable over time. You build a clear picture of what your specific audience responds to, and every new piece of content you produce gets informed by that history. That compounding effect is why analytics discipline matters early. The data you collect in month one directly shapes how much stronger your content strategy looks six months from now, which is why getting the setup right from the start pays off far more than most teams expect.
What you can measure in Sprout Social analytics
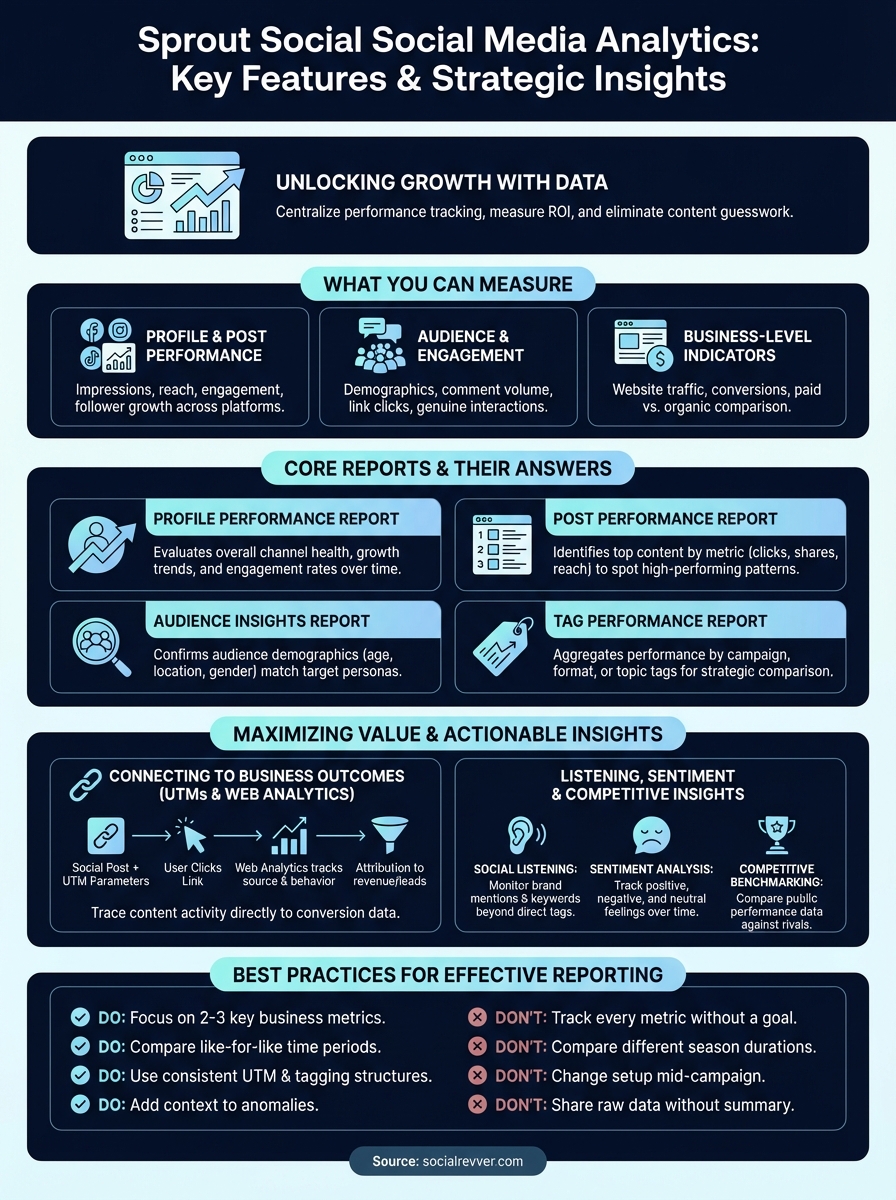
Sprout Social social media analytics covers a wide range of data points, and understanding the full scope of what the platform tracks is the first step toward using it effectively. The measurement capabilities span from individual post performance all the way up to business-level indicators, which means you can zoom in on a single piece of content or zoom out to evaluate your entire social presence in one consolidated view.
Profile and post-level performance
At the most granular level, Sprout lets you measure how individual posts and your overall profiles perform across every connected platform. For each post, you can track impressions, reach, clicks, shares, saves, and reactions in one place rather than jumping between native apps. At the profile level, you get follower growth trends, posting frequency data, and aggregate engagement rates over any time range you select, which makes it straightforward to spot patterns across weeks or months of content activity.
Audience and engagement metrics
Beyond raw numbers, Sprout gives you data on who is engaging with your content and exactly how they are interacting with it. You can break down audience demographics including age, location, and gender to confirm whether your content is pulling in the specific people you are trying to reach. Engagement metrics go deeper than a simple like count, letting you see comment volume, reply behavior, and link click data that signals how your audience is genuinely responding to what you publish rather than just scrolling past it.
Reach tells you how many people saw your content. Engagement tells you whether they cared enough to do something about it.
Business-level indicators
This is where Sprout moves beyond surface-level reporting and into territory that directly matters for growth decisions. You can connect social activity to website traffic and conversion data by integrating Sprout with your web analytics setup, giving you a traceable line between a published post and a real business outcome. Tracking paid versus organic performance side by side lets you see whether your ad spend is amplifying the right content or simply pushing budget behind posts that would have underperformed anyway. For founders and operators focused on inbound leads and revenue impact rather than follower counts, this measurement layer is where Sprout justifies its place in your tech stack.
How Sprout pulls and organizes your social data
Before you can trust the numbers inside Sprout Social social media analytics, it helps to understand where those numbers come from and how the platform structures them. Sprout connects directly to each social network through official API integrations, which means it pulls data straight from the source rather than relying on scraping or third-party workarounds. That matters because API-sourced data is more accurate, more stable, and less likely to break when platforms update their systems.
How Sprout connects to your social profiles
Setting up data collection in Sprout starts with linking your social profiles through the platform's account connection flow. Each supported network, including Instagram, Facebook, LinkedIn, TikTok, X (formerly Twitter), and Pinterest, grants Sprout read and write access through its own API. Once connected, Sprout begins pulling historical and real-time performance data for every profile you add, including post metrics, audience growth data, and engagement signals. The depth of historical data you can access depends on what each platform's API allows, which varies by network, but for most channels you get enough historical data to establish meaningful baselines within the first week of connection.
The quality of your analytics output depends entirely on the quality of the data going in, and API-based ingestion is the most reliable foundation you can build on.
How Sprout organizes data once it's in the platform
Once the data is flowing in, Sprout uses a profile grouping system that lets you organize your connected accounts into logical sets. You can group accounts by brand, region, team, or campaign, which makes filtering reports and isolating specific slices of your social presence much easier. Instead of viewing all your data in one undifferentiated pile, you control how the platform surfaces information based on the structure that makes sense for how your business actually operates.
Sprout also tags and categorizes content automatically based on post type, network, and publishing source, so when you pull a report, the data is already segmented in ways that make analysis faster. If you use Sprout's own publishing tools, it can tie performance data directly back to specific campaigns or content labels you set up in advance, which gives you a clean, searchable record of every piece of content alongside its results.
Core reports in Sprout Social and what each answers
Sprout Social gives you several distinct report types, and each one is designed to answer a specific question about your social presence. Understanding which report to pull for which question saves you time and gets you to the insight you actually need faster. Here is a breakdown of the core reports inside Sprout Social social media analytics and the specific decisions each one supports.
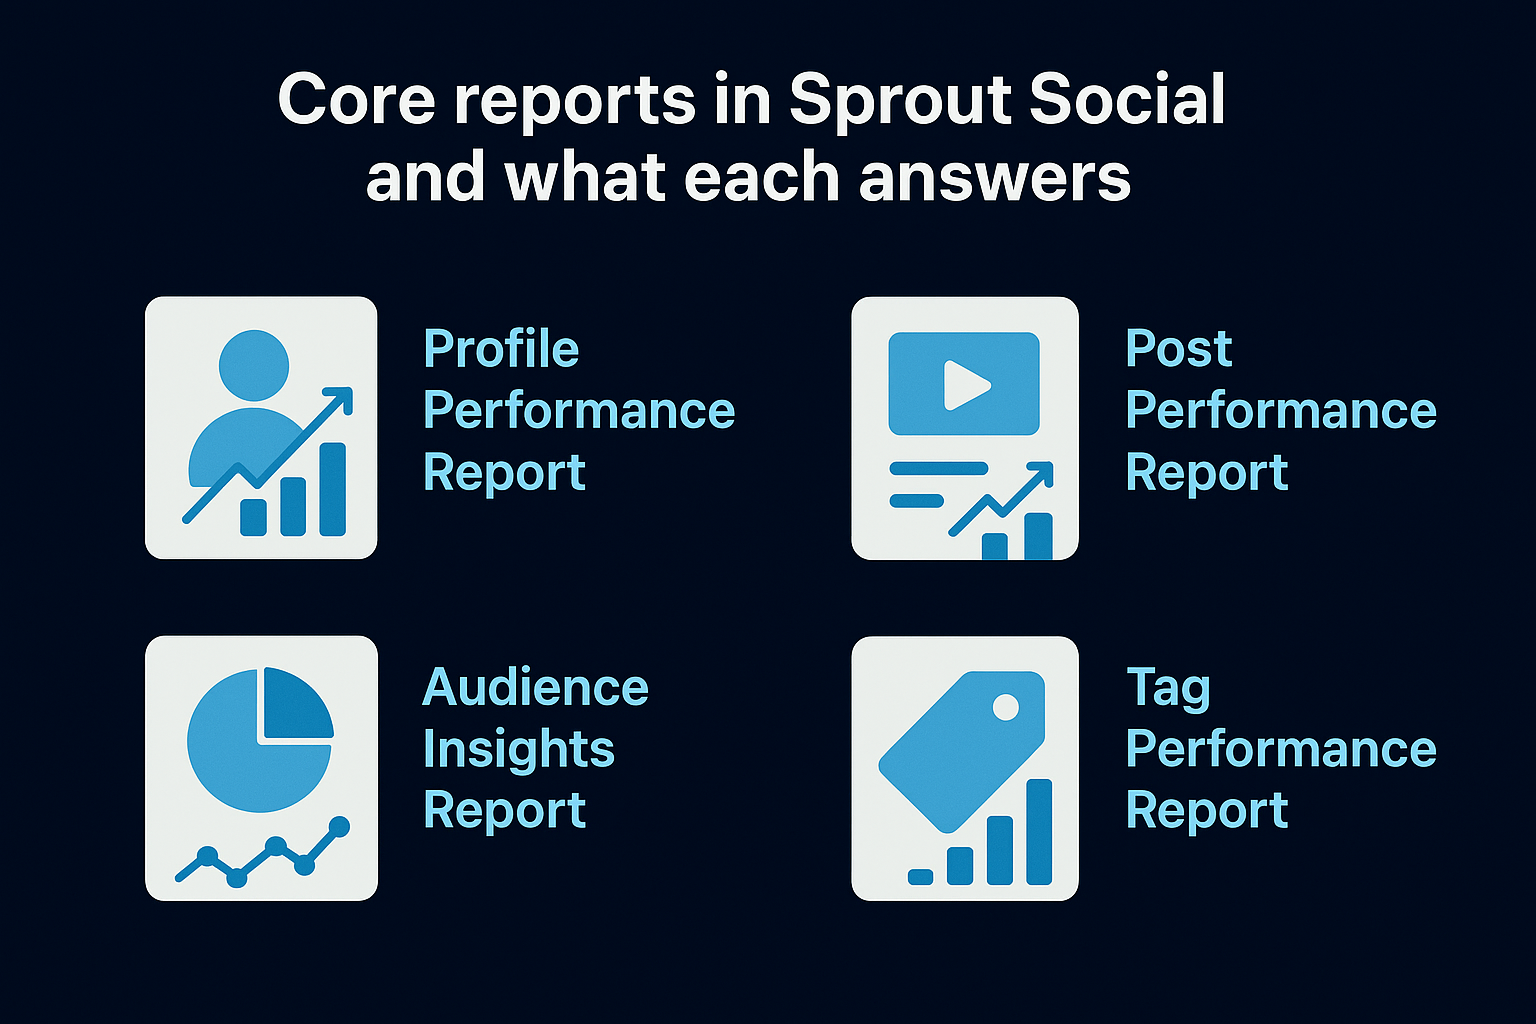
Profile Performance Report
The Profile Performance Report shows you how your accounts are growing and engaging over a selected time period. You can measure follower growth, impressions, reach, and engagement rate at the profile level, which gives you a clear picture of whether your overall presence is moving in the right direction. This report is the right starting point when you need to evaluate the health of a channel or compare performance across two different time frames.
Post Performance Report
This report gets granular. The Post Performance Report lets you rank every published post by any metric you choose, including clicks, shares, reach, or engagement, so you can identify your top-performing content at a glance. Use this report when you want to understand which specific pieces of content are pulling the most weight and which formats are consistently underperforming. Sorting by click data is especially useful when you want to see which posts are actually sending people to your website rather than just generating passive views.
The posts that drive clicks tell you far more about purchase intent than the posts that simply drive likes.
Audience Insights Report
The Audience Insights Report tells you who is paying attention to your content. It surfaces demographic data including age ranges, gender breakdown, and geographic location for your followers and engaged users. This report matters most when you want to confirm that the audience you are building matches the audience you are trying to reach, and it flags misalignment early before you invest months of content production targeting the wrong people.
Tag Performance Report
If you use Sprout's tagging system to label your content by campaign, format, or topic, this report becomes one of the most valuable tools in the platform. The Tag Performance Report aggregates performance data across every post that shares a tag, letting you compare how different content categories perform against each other. This is how you move from post-level guesswork to pattern-level strategy that actually compounds over time.
How to build a stakeholder-ready report in Sprout
Pulling data is only half the job. The other half is presenting it in a way that your stakeholders can act on it. A report built for a CFO looks completely different from one built for a social media manager, and Sprout Social's report builder gives you the flexibility to tailor the output for whoever needs to make a decision based on what you show them.
Choose your metrics before you open the report builder
Before you touch a setting inside Sprout Social social media analytics, get clear on the single question your report needs to answer. If your stakeholder cares about revenue impact, your report leads with click-through rates, referral traffic, and conversion data. If they care about brand visibility, you lead with reach, impressions, and follower growth. Deciding on that focus upfront keeps you from building a report that buries the relevant data under metrics that mean nothing to the person reading it.
If your stakeholder can't summarize the report in one sentence, the report is doing too much.
Write down the one conclusion your stakeholder should walk away with before you start selecting widgets. That sentence becomes the filter for every data point you include or cut, which saves time and produces a cleaner, more convincing document.
Structure, export, and schedule for impact
Sprout lets you drag and drop widgets into a custom layout, so build the report like a narrative. Open with your highest-level result, then support it with the data that explains why. For example, lead with overall engagement or reach for the period, then follow with the post-level breakdown that shows which content drove that number. That structure guides your stakeholder through the data instead of forcing them to interpret it alone.
Once the layout is set, use these steps to deliver it efficiently:
- Set a recurring schedule: Use Sprout's automated delivery to send the report monthly or weekly without rebuilding it each time.
- Choose the right format: Export as PDF for presentation use or CSV if your stakeholder plans to analyze the raw data further.
- Add context in the cover note: A two-sentence summary of the key takeaway makes the report immediately useful before the reader opens the first chart.
How to track ROI with UTMs and web analytics
Sprout Social social media analytics tells you a lot about what happens on the platform itself, but the most important question for most businesses is what happens after the click. To answer that, you need to connect your social data to your web analytics setup using UTM parameters, which are short tracking codes you append to URLs in your posts. When someone clicks a tagged link, your web analytics platform records exactly where that visitor came from and what they did on your site, giving you a traceable line between a specific post and a real business outcome.
Without UTMs, your web analytics platform attributes social visitors to a generic channel, and you lose the ability to credit specific posts or campaigns with the traffic they drove.
Building UTM parameters for your social posts
UTMs are built from five parameters, and you only need three of them consistently to get clean, useful data. Use utm_source to identify the platform (for example, "instagram" or "linkedin"), utm_medium to label the channel type (use "social" consistently), and utm_campaign to tag the specific campaign or content series the post belongs to. Keeping your naming conventions consistent from the start is critical because inconsistent labeling creates fragmented data that is nearly impossible to analyze at scale.
You can build UTMs manually using Google's Campaign URL Builder, which generates a properly formatted tagged URL in seconds. Once you have the tagged URL, paste it into your Sprout post during scheduling. Sprout will shorten the link if needed, but the tracking parameters pass through intact, so your analytics platform still captures every data point correctly.
Connecting Sprout data to your web analytics results
Once your UTMs are in place and your Google Analytics account is tracking traffic by source and campaign, you can start matching Sprout's engagement data against your web analytics conversion data. Pull the post-level click data from Sprout for a given time period, then open your web analytics platform and filter traffic by the UTM campaign values you assigned. The overlap between those two data sets tells you which posts drove qualified traffic and which ones generated clicks that went nowhere.
Running this analysis consistently each month gives you a clear picture of which content types produce the highest-quality traffic for your site, and it gives you the evidence you need to shift budget and creative energy toward formats that actually generate leads rather than just impressions.
Listening, sentiment, and competitive insights in Sprout
Sprout Social social media analytics goes beyond tracking your own content performance. The platform also gives you tools to monitor what people are saying about your brand across the internet, how they feel about it, and how your presence stacks up against direct competitors in your space. These three capabilities, listening, sentiment analysis, and competitive benchmarking, turn Sprout from a reporting tool into a genuine market intelligence resource.
Social listening and what it tracks
Sprout's listening feature lets you monitor conversations across social platforms based on keywords, brand mentions, hashtags, and topics you define. You set up a listening query with the terms you want to track, and Sprout aggregates every public post that matches those terms into a single feed. This gives you visibility into what your audience is saying about you even when they do not tag your account directly, which is often where the most honest feedback lives.
Using listening data effectively means checking it regularly and treating it as a source of content ideas as much as a reputation management tool. When you notice a recurring question or frustration showing up in conversations around your brand or category, that is direct signal for what your next piece of content should address.
The conversations happening without your tag are often more valuable than the ones where people are talking directly to you.
Sentiment analysis in Sprout
Sprout categorizes the conversations it captures into positive, negative, and neutral sentiment buckets, giving you a measurable read on how your audience feels about your brand over time. You can track sentiment shifts across specific time windows, which means a spike in negative sentiment around a particular date becomes a visible data point you can investigate rather than a vague concern you cannot quantify. Monitoring sentiment trends consistently lets you catch reputation issues early before they compound into a larger problem.
Competitive benchmarking
Sprout lets you add competitor profiles to your reports and pull side-by-side comparisons of follower growth, posting frequency, and engagement rates. You are not seeing their private analytics, only their public-facing performance data, but that is enough to identify gaps in your strategy. If a competitor consistently outperforms you on engagement while posting less frequently, that is a signal worth investigating through the lens of content quality and format, not volume.
Common mistakes and reporting best practices
Even teams with access to a well-configured Sprout Social social media analytics setup make avoidable errors that dilute the quality of their reporting. The data is only as useful as the habits you build around collecting and interpreting it, so understanding where most teams go wrong is just as valuable as knowing which reports to pull.
Mistakes that undermine your reporting
The most common mistake is tracking too many metrics at once without a clear question driving the analysis. When every number gets equal attention, nothing gets acted on. You end up with a crowded report that takes time to build and produces no clear takeaway. Pick two or three metrics that directly connect to the outcome your team is responsible for, and measure those consistently before you add anything else to your dashboard.
Reporting on everything is functionally the same as reporting on nothing.
Another frequent problem is comparing data across incompatible time periods. Pulling one week of data against the previous month, or comparing a holiday period to a regular week, produces misleading numbers that send you in the wrong direction. Always compare like-for-like periods, specifically the same length of time under similar conditions, so the variance you see in the data reflects actual performance changes rather than calendar effects.
Best practices that make reports useful
Building reporting habits that hold up over time starts with consistency in setup before consistency in analysis. That means locking in your UTM naming conventions, your profile grouping structure, and your tag taxonomy before you publish the first piece of content you plan to measure. Changing those inputs mid-campaign creates gaps in your historical data that you cannot recover.
From there, use this checklist to keep each reporting cycle clean and useful:
- Set a fixed review cadence: Weekly for tactical adjustments, monthly for strategic decisions.
- Document your benchmarks: Record your baseline metrics at the start of each quarter so you have a reference point for evaluating progress.
- Flag anomalies with context: When a metric spikes or drops, note the external factor that may have caused it directly in the report so future readers do not misread it as a trend.
- Share reports with a written summary: One paragraph explaining the key finding saves your stakeholders from interpreting raw numbers on their own.
Treating your reporting process as a system you refine over time rather than a one-time task is what separates teams that learn from their data from teams that just collect it.
Next steps
Sprout Social social media analytics gives you the tools to measure what matters, but the data only creates value when you act on it consistently. Start by connecting your profiles, locking in your UTM naming conventions, and identifying the two or three metrics that tie directly to your business goals. Build your first stakeholder-ready report before the end of the month so you have a baseline to measure every future period against.
Analytics tells you what is working, but it does not build the content system that produces results worth measuring in the first place. If your short-form content strategy is inconsistent, guesswork-driven, or simply not generating the inbound attention your brand deserves, that is the upstream problem no dashboard can fix on its own. SocialRevver builds the entire content engine for you, from strategy and scripting to production and distribution. Get your free 40+ slide social media strategy and see exactly what a data-driven system looks like for your brand.