
Retention rate is one of the most telling numbers in any business. Whether you're tracking customers, employees, or subscribers, knowing how to calculate retention rate gives you a clear picture of what's working and what's quietly bleeding value. Yet many founders and business owners either skip this metric entirely or calculate it incorrectly, then wonder why growth feels like running on a treadmill.
At SocialRevver, we build content systems that turn attention into lasting audience relationships. That work depends on understanding retention at every level, from viewer retention on short-form video to the customer retention rates that determine long-term revenue. A strong retention rate means your brand is doing more than attracting attention; it's holding it.
This guide breaks down the exact retention rate formula, walks through each calculation step, and includes real examples across different contexts so you can apply the math to your own business right away.
What retention rate means and when to use it
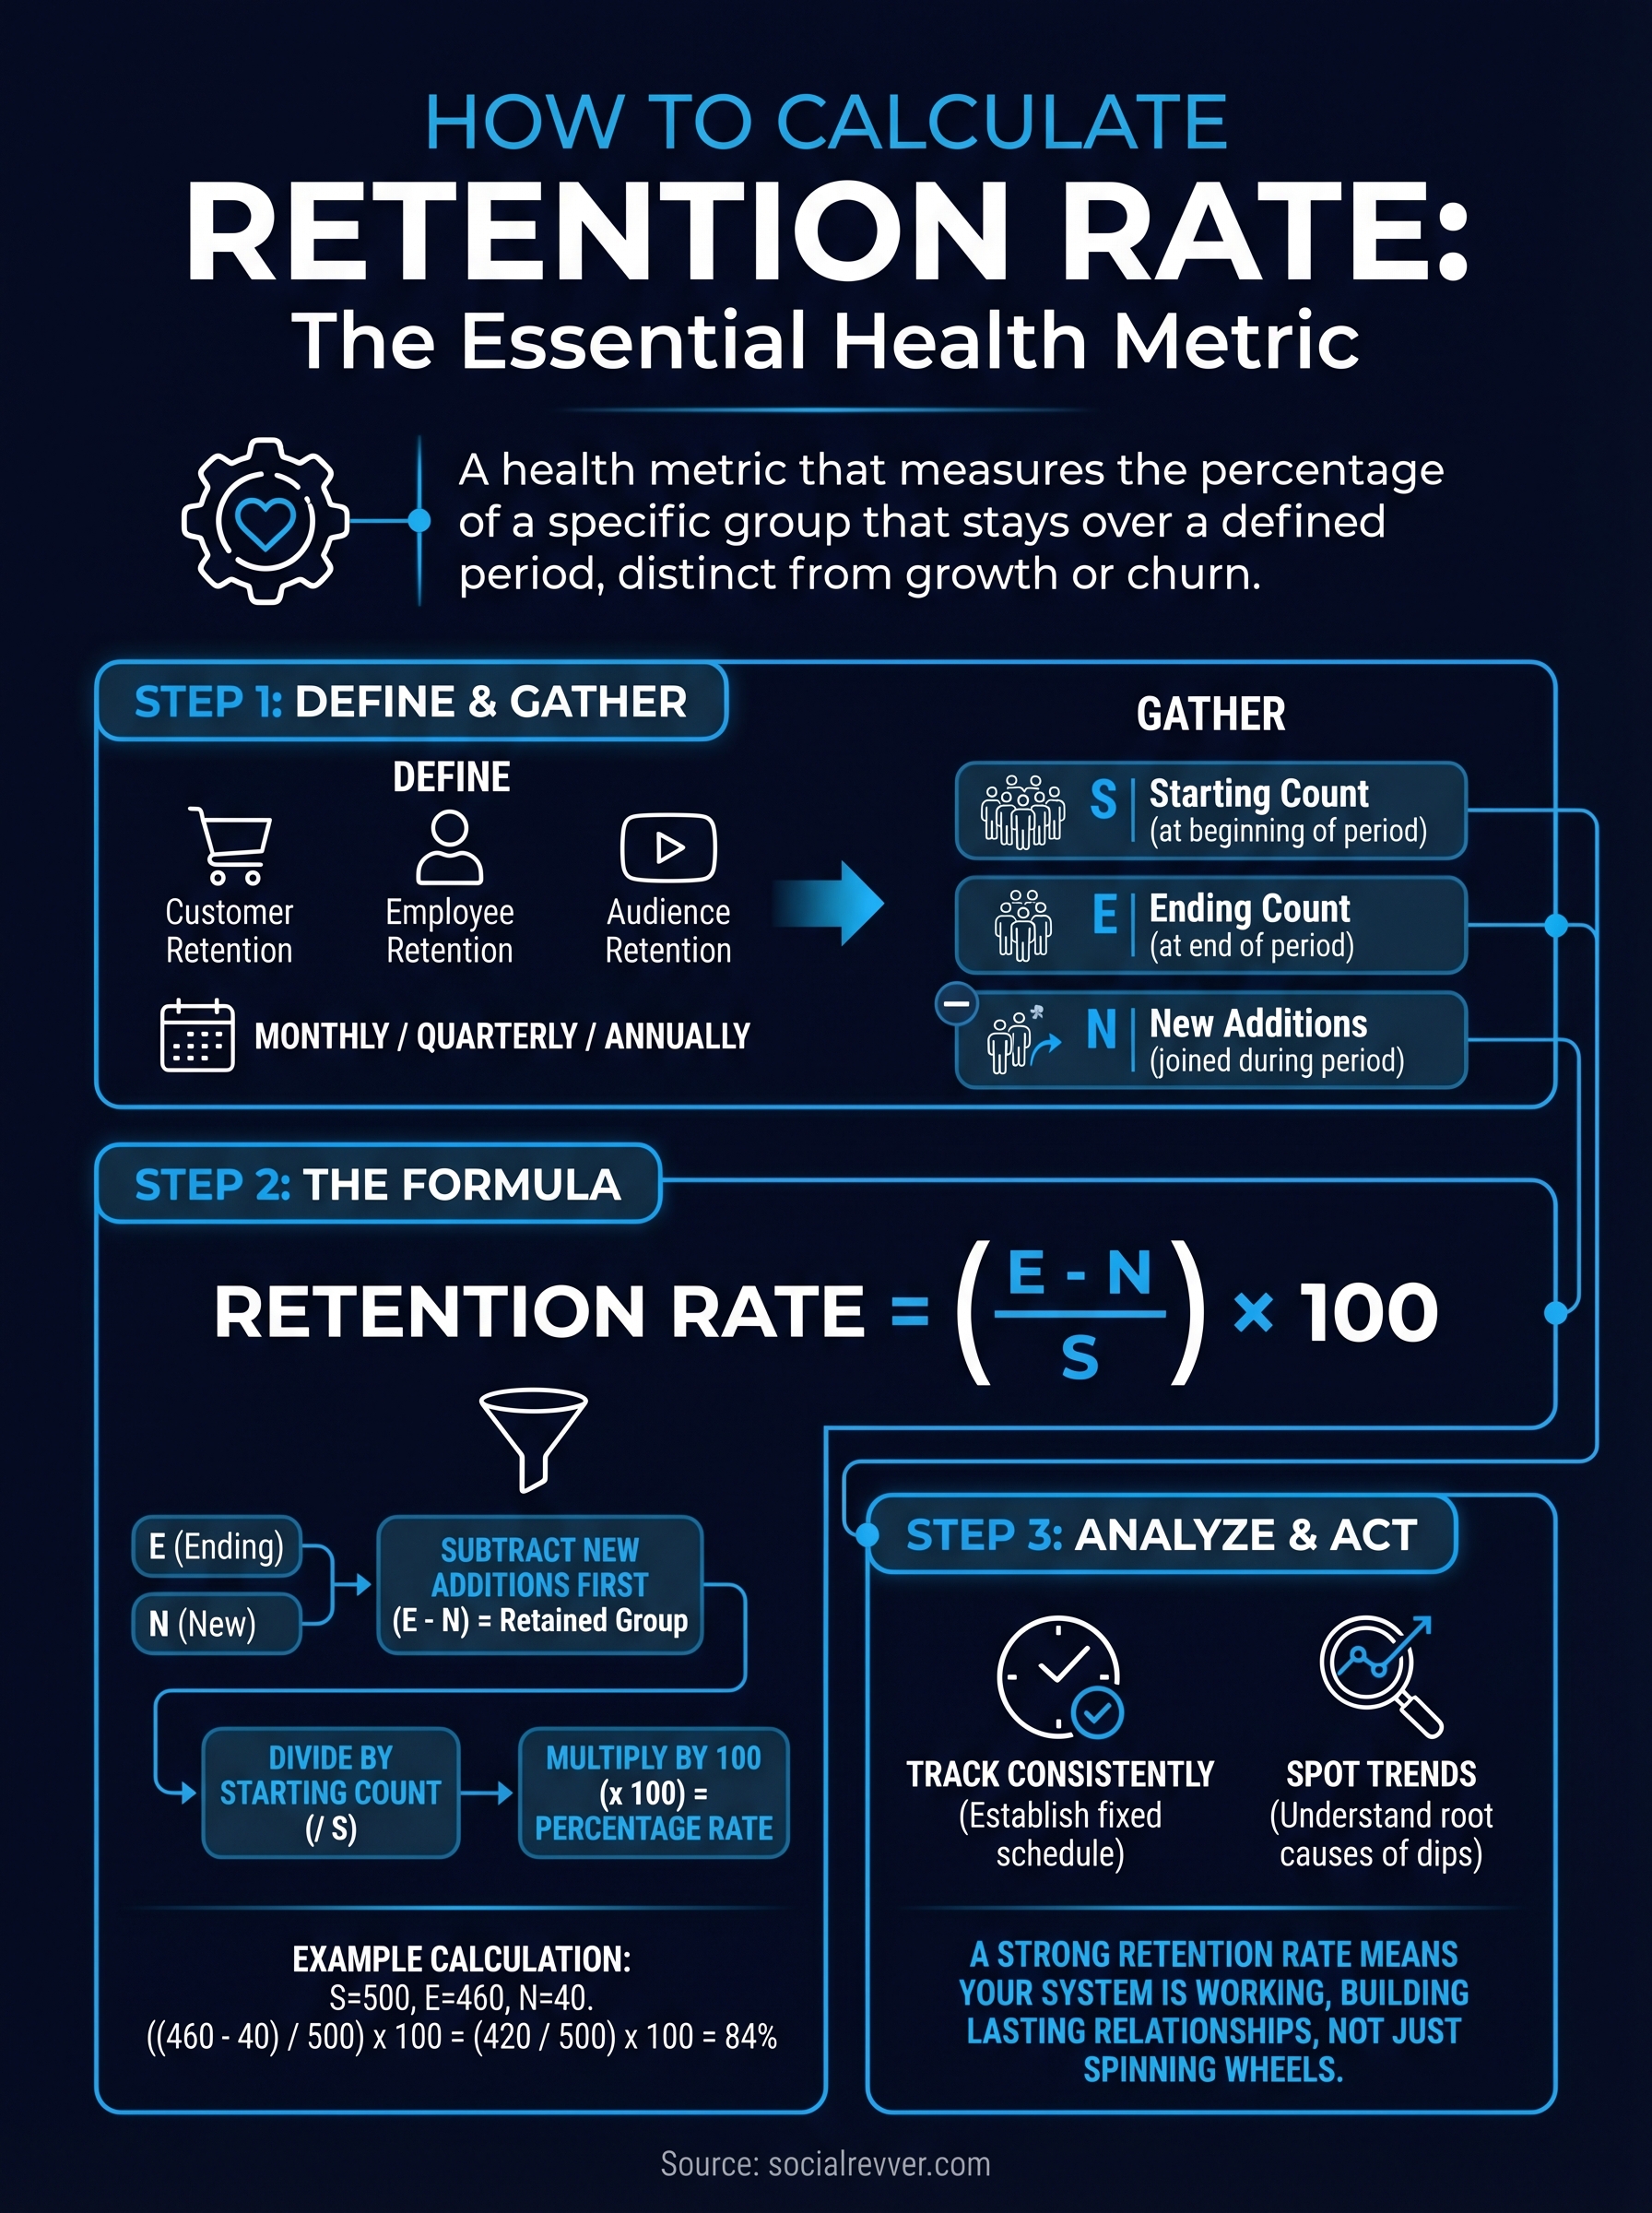
Retention rate measures the percentage of a specific group that stays with you over a defined period. That group could be customers who keep buying, employees who stay on staff, subscribers who remain active, or viewers who watch your content to the end. The number tells you, in plain terms, how well you hold onto the people you've already won over rather than how many new ones you're adding. It is a direct signal of system health, not just surface-level activity.
Retention rate is a health metric, not a growth metric. It tells you whether your system is working or just spinning its wheels.
The difference between retention and churn
These two numbers are related but not interchangeable. Retention rate tracks who stayed; churn rate tracks who left. If your retention rate is 80%, your churn rate is 20%. Both numbers describe the same reality, but retention rate is generally more useful when you want to benchmark performance over time or present progress to stakeholders. Most businesses prefer tracking retention rate because it frames the data in a forward-facing, goal-oriented way that makes trends easier to act on.
When you should calculate retention rate
You do not need to run this calculation daily, but you do need to run it on a consistent, fixed schedule. Common use cases include quarterly business reviews, annual HR reporting, content performance audits, and subscription health checks. Knowing how to calculate retention rate becomes especially important when you notice unexplained dips in revenue or engagement, because retention is often the root cause hiding underneath those symptoms. Run it any time you need a clear signal of whether your audience, team, or customer base is holding steady or quietly shrinking.
Step 1. Choose your retention type and time period
Before you run any numbers, you need to define what type of retention you're measuring and which time window you're using. Mixing up these two variables is the most common reason people end up with a number that looks fine on paper but tells them nothing useful. Get these two decisions locked in first, and the rest of how to calculate retention rate becomes straightforward.
Pick the retention type that matches your goal
The type you choose determines which data you pull and what counts as "retained." Different business models track different groups, so make sure the type matches your actual goal. Here are the three most common types:
- Customer retention: Tracks buyers who return or keep a subscription active
- Employee retention: Tracks staff who remain on payroll
- Audience retention: Tracks viewers or subscribers who stay engaged over time
Set a clear time period
Your time period needs to be fixed and consistent every time you run the calculation so your numbers stay comparable across reporting cycles. Monthly works well for subscriptions and content performance. Quarterly or annually fits better for employee and customer data. Pick one interval and stick to it across every report.
Changing your time period mid-track makes your retention data useless for spotting real trends.
Step 2. Gather the right counts
Once you've locked in your retention type and time period, you need exactly three data points to move forward. Getting these numbers right is the step most people rush through, and that's where errors in how to calculate retention rate tend to start.
The three numbers you need
Every retention calculation depends on the same core inputs: the starting count, the ending count, and the number of new additions during the period. Here's what each one means in practice:
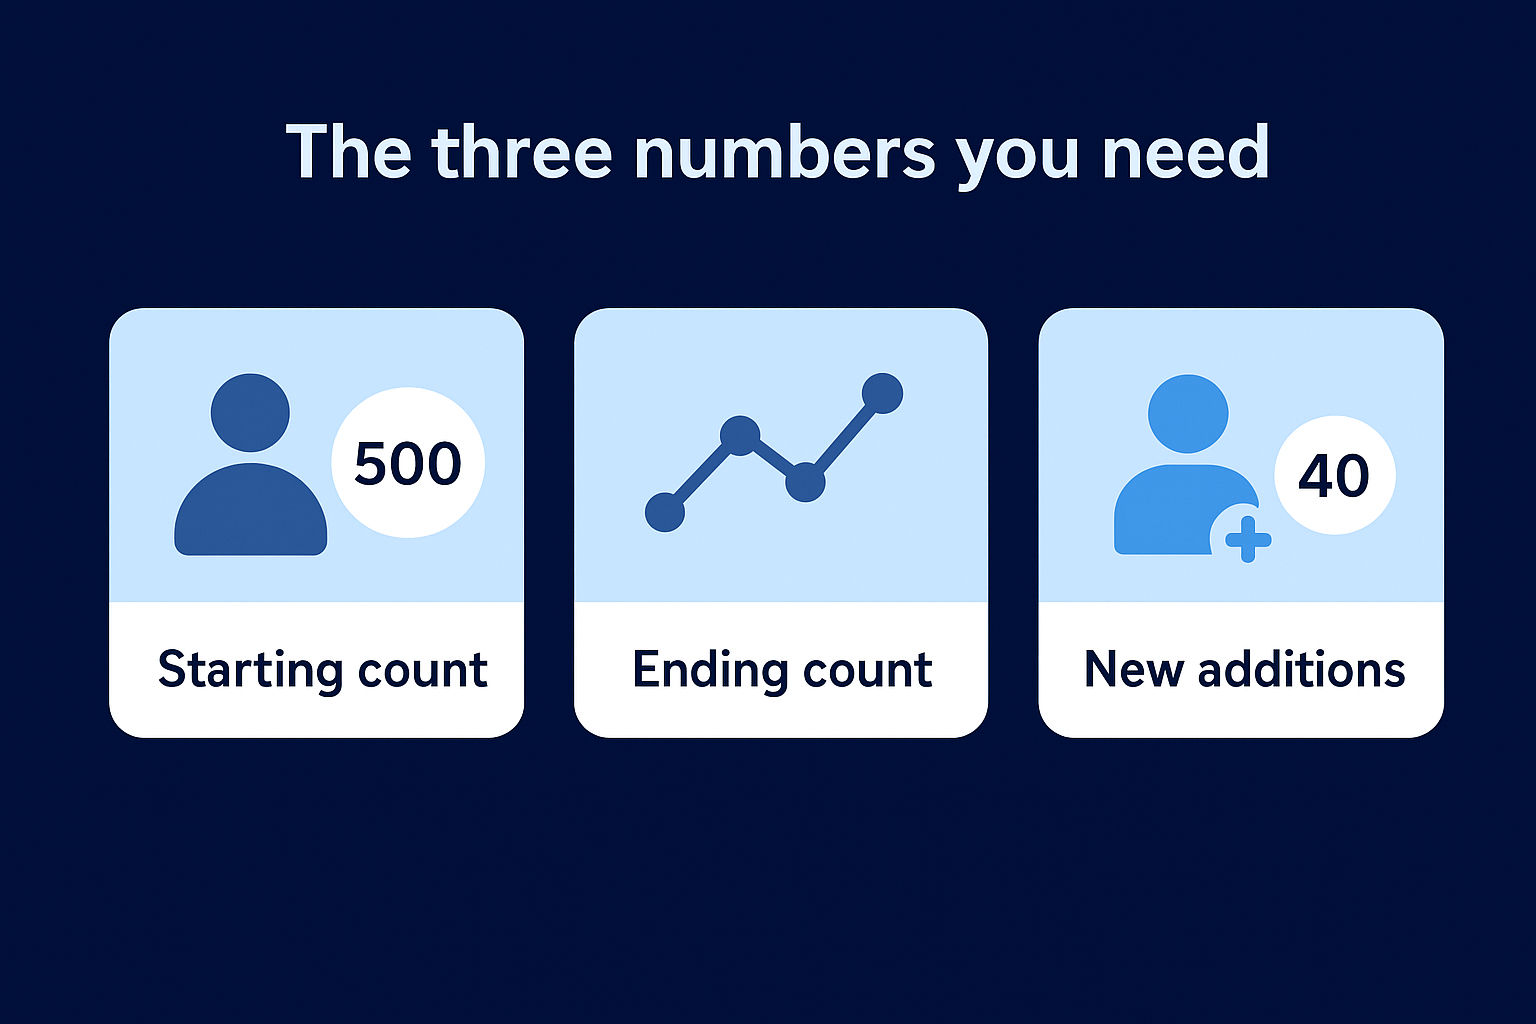
| Input | What it represents | Example |
|---|---|---|
| Starting count (S) | How many at the start of the period | 500 customers on Jan 1 |
| Ending count (E) | How many at the end of the period | 460 customers on Mar 31 |
| New additions (N) | How many joined during the period | 40 new customers in Q1 |
Where to pull the data
Your CRM, HR system, or analytics platform holds all three numbers. Pull the starting count from a snapshot at the beginning of your chosen period, then record the ending count on the last day. Subtract new additions separately so you don't confuse genuine retention with fresh growth.
Never count new additions as retained; doing so inflates your number and hides real churn.
Step 3. Calculate retention rate with the formula
With your three data points in hand, you're ready to run the actual calculation. The formula for how to calculate retention rate is simple and works across every retention type you identified in Step 1.
The standard retention rate formula
The formula strips out new additions before dividing, which ensures you're only measuring genuine retention and not masking churn with fresh sign-ups.
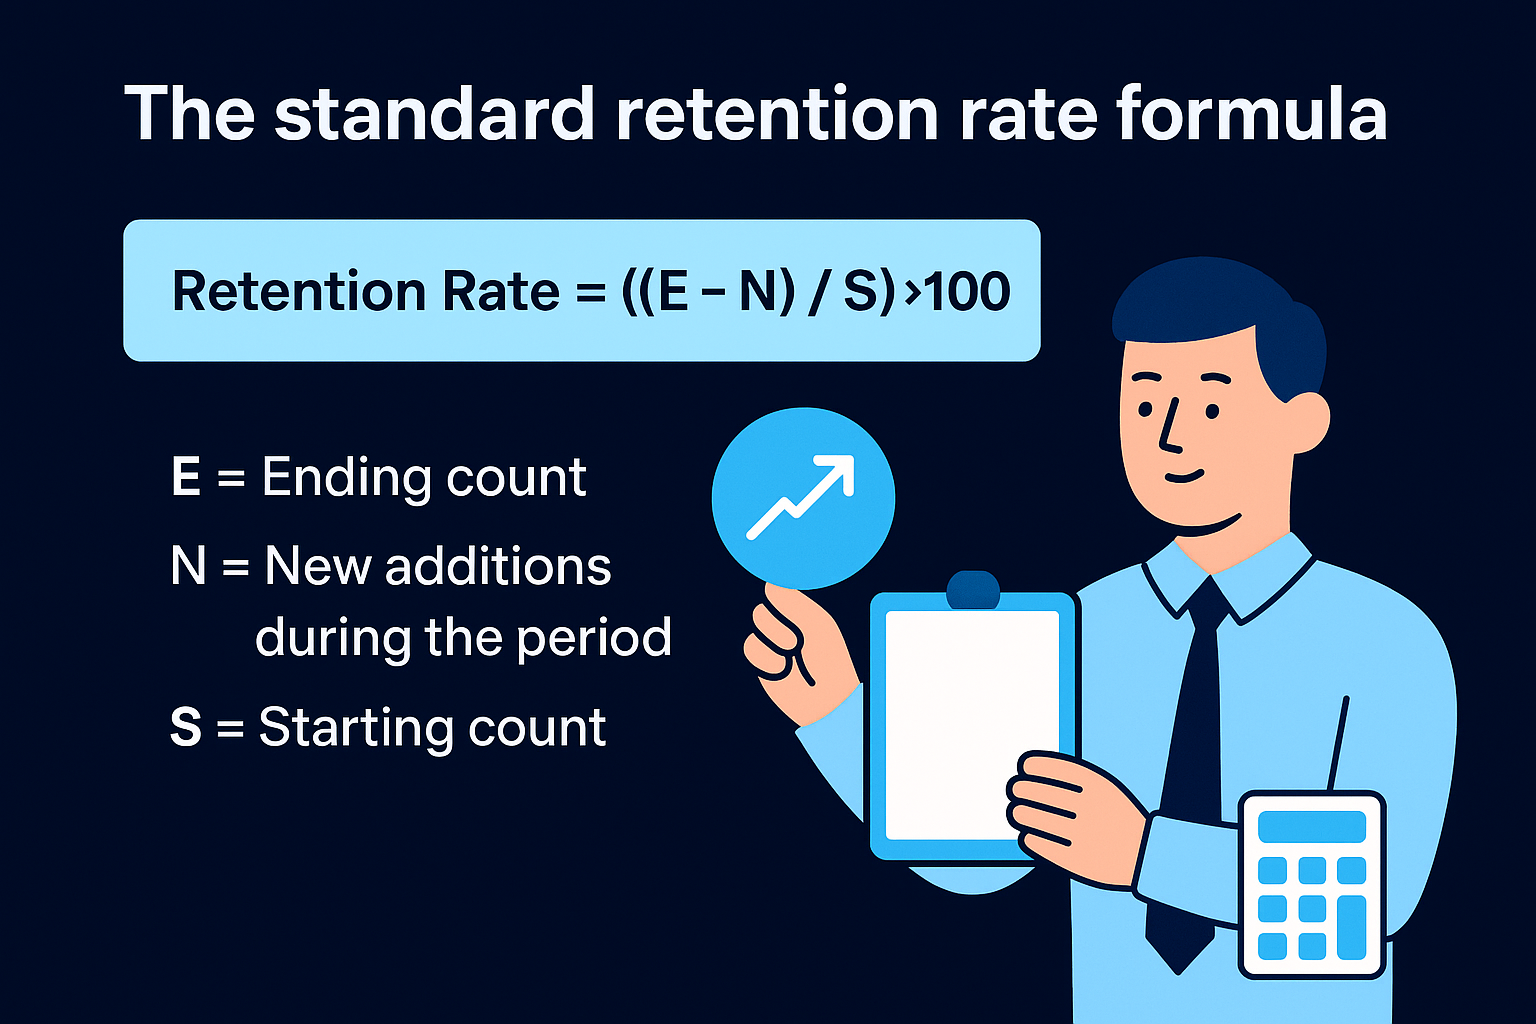
Retention Rate = ((E - N) / S) × 100

Where:
E = Ending count
N = New additions during the period
S = Starting count
Subtract new additions first, then divide by the starting count. Skipping this step is the most common way to inflate your retention rate.
Apply the formula to your numbers
Plug in the example values from Step 2: S = 500, E = 460, N = 40. The calculation runs as follows:
((460 - 40) / 500) × 100
= (420 / 500) × 100
= 84%
Your retention rate for that quarter is 84%. That means you kept 84 out of every 100 customers you started with, independent of any new growth during the period. Run this same sequence each reporting cycle to build a reliable trend line.
Step 4. Work examples and calculate in Excel
Seeing the formula in action across different scenarios makes the logic click faster than reading it in the abstract. Below are two examples that show how to calculate retention rate across different contexts, followed by an Excel setup you can replicate in minutes.
Employee retention example
Your company starts Q1 with 200 employees, ends the quarter with 185, and hired 10 new staff during that period. Plug those numbers in:
((185 - 10) / 200) × 100
= (175 / 200) × 100
= 87.5%
An 87.5% quarterly employee retention rate is a strong signal, but track it over four consecutive quarters to confirm the trend holds.
How to build the formula in Excel
Open a blank spreadsheet and set up four labeled cells to keep your inputs organized and easy to update each reporting cycle:
Cell B1: Starting count (S)      → e.g., 200
Cell B2: Ending count (E)        → e.g., 185
Cell B3: New additions (N)       → e.g., 10
Cell B4: Retention Rate Formula  → =((B2-B3)/B1)*100
Type your real numbers into B1 through B3, and B4 calculates the result automatically. Update those three input cells each period and your retention rate refreshes instantly without rebuilding the formula.
Next Steps
You now have everything you need to know how to calculate retention rate across customer, employee, and audience contexts. The formula is straightforward, but the value comes from running it consistently every reporting cycle and using the results to drive real decisions rather than treating the number as a one-time exercise.
Track your retention rate on a fixed schedule, compare it against previous periods, and look for patterns that explain movement in either direction. A rising rate tells you something is working; a falling one tells you to find the root cause before it compounds. Strong retention proves that your systems are building lasting relationships with the people who matter most to your business.
Building reliable audience retention starts with a content system that holds attention beyond the first view. If you want that kind of system working for your brand, apply to work with the SocialRevver team and get a free 40-slide social media strategy built specifically for your goals.